
July 13, 2025 a 03:12 pm


Retail Stocks - Performance Analysis
📊 The retail sector, a cornerstone of the economy, showcases a volatile yet intriguing pattern over the recent periods. Varying performances across major retail stocks underline the dynamic nature of consumer behavior and macroeconomic influences. This analysis delves into the performance metrics over one week, one month, and three months, highlighting key trends and notable shifts across these leading companies.
Retail Stocks Performance One Week
💡 The past week's analysis reveals a mix of positive and negative performance across retail stocks. Amazon leads with a modest increase, while Walmart struggles significantly, reflecting an unexpected downturn. The performance variations are mainly a consequence of fluctuations in consumer sentiment and market reactions to quarterly reports.
| Stock | Performance (%) | Performance |
|---|---|---|
| AMZN | 0.75% | |
| TGT | 0.23% | |
| ULTA | -0.17% | |
| HD | -0.43% | |
| DG | -0.78% | |
| COST | -1.69% | |
| TJX | -1.72% | |
| LOW | -1.81% | |
| JD | -2.98% | |
| WMT | -4.04% |
Retail Stocks Performance One Month
📈 Over the past month, Target emerges as the top performer with significant gains, indicative of strong corporate strategies or market reception, whereas JD.com continues to decline. The overall trend suggests that selective retail stocks are capitalizing on favorable market conditions.
| Stock | Performance (%) | Performance |
|---|---|---|
| TGT | 9.21% | |
| AMZN | 6.12% | |
| HD | 4.33% | |
| ULTA | 3.89% | |
| LOW | 3.27% | |
| DG | 1.48% | |
| WMT | 0.07% | |
| TJX | -0.11% | |
| COST | -1.96% | |
| JD | -4.93% |
Retail Stocks Performance Three Months
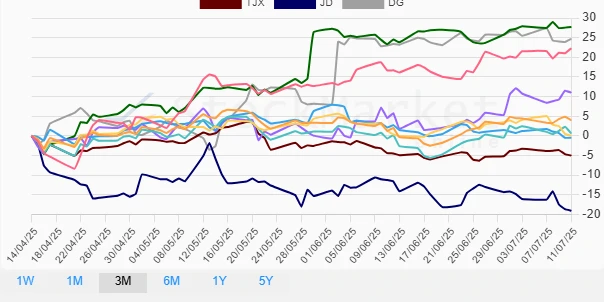
✅ Over the three-month horizon, there is an evident dominance by ULTA Beauty and Dollar General, both of which have seen substantial appreciation. Conversely, JD.com continues its downtrend, highlighting potential strategic or macroeconomic challenges affecting its business model.
| Stock | Performance (%) | Performance |
|---|---|---|
| ULTA | 27.70% | |
| DG | 24.69% | |
| AMZN | 22.27% | |
| TGT | 11.01% | |
| HD | 3.99% | |
| LOW | 0.65% | |
| WMT | 0.02% | |
| COST | -0.48% | |
| TJX | -5.02% | |
| JD | -19.06% |
Summary
🗣️ The retail sector's performance over these time frames highlights significant disparities among companies. A notable uptrend is seen in ULTA Beauty and Dollar General, suggesting robust strategic positioning or an effective response to market demand. Conversely, JD.com is on a downturn across all periods, indicating strategic misalignments or external adversities affecting its competitive edge. Stakeholders should consider these trends for strategic re-alignments and potential investment opportunities, focusing on the adaptability and risk resilience of these corporations.
Smart Data Insight
Master the Perfect Entry & Exit for this Stock
Don't leave your profits to chance. Historically, this stock follows specific seasonal patterns that institutional traders use to maximize returns.
- ✅ Identify the "Golden Buying Window"
- ✅ Avoid high-risk correction cycles
- ✅ Backtested data from the last 20+ years