
July 12, 2026 a 03:12 pm


Retail Stocks - Performance Analysis
The retail sector has exhibited a diverse range of performances over recent periods, reflecting the fluctuating consumer demand and macroeconomic conditions. While some stocks showcased resilience and growth, others faced challenges, underlining the competitive and often volatile nature of the retail market. This analysis delves into the intricacies of retail stock performance over various time frames, identifying trends, top performers, and those that lagged behind. 📊
Retail Stocks Performance One Week
Over the past week, JD emerged as the top performer with a significant increase, while LOW experienced the largest decline. The sector displayed mixed results, highlighting both growth potential and areas of concern. As consumer behavior continues to evolve, these short-term movements can provide insights into market sentiment.
| Stock | Performance (%) | Performance |
|---|---|---|
| JD | 5.88% | |
| TGT | 3.87% | |
| WMT | 1.86% | |
| ULTA | 1.74% | |
| AMZN | 1.11% | |
| DG | 0.69% | |
| TJX | -1.87% | |
| COST | -3.70% | |
| HD | -4.09% | |
| LOW | -7.14% |
Retail Stocks Performance One Month
The one-month analysis identifies HD as a leader within the sector, while TJX has seen significant downturns. Market dynamics and external pressures, such as inflation and supply chain disruptions, may have influenced these outcomes. Strategic initiatives and consumer spending patterns will be key drivers in future performance.
| Stock | Performance (%) | Performance |
|---|---|---|
| HD | 4.82% | |
| DG | 4.02% | |
| AMZN | 3.22% | |
| ULTA | 0.78% | |
| TGT | 0.57% | |
| JD | -0.95% | |
| LOW | -3.88% | |
| WMT | -5.83% | |
| COST | -6.74% | |
| TJX | -10.38% |
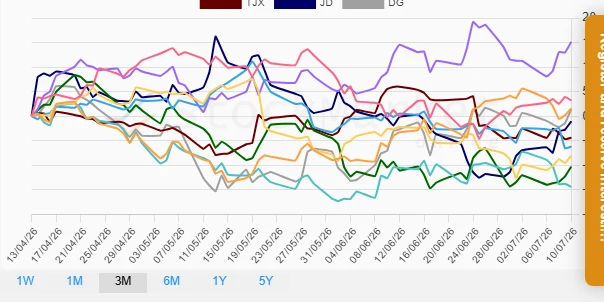
Retail Stocks Performance Three Months
Over the last quarter, TGT was a standout performer, recording notable gains. In contrast, stocks like LOW and ULTA suffered the most. The broader market conditions alongside sector-specific issues such as inventory management and consumer confidence impacted these trends significantly.
| Stock | Performance (%) | Performance |
|---|---|---|
| TGT | 15.12% | |
| AMZN | 3.23% | |
| HD | 1.55% | |
| DG | 1.36% | |
| TJX | -4.38% | |
| COST | -6.20% | |
| JD | -1.07% | |
| ULTA | -10.29% | |
| WMT | -8.04% | |
| LOW | -14.40% |
Summary
📈 The retail stock market over the past quarter has displayed a mixture of fortunes influenced by external economic conditions and firm-specific issues. Target (TGT) showcased strong resilience over the three-month period, whereas Lowe's (LOW) faced significant headwinds. The diverse performance implies that while opportunities exist, caution is warranted. Investors should continue to monitor macroeconomic trends and anticipate shifts in consumer preferences for strategic investment decisions. 💡
Smart Data Insight
Master the Perfect Entry & Exit for this Stock
Don't leave your profits to chance. Historically, this stock follows specific seasonal patterns that institutional traders use to maximize returns.
- ✅ Identify the "Golden Buying Window"
- ✅ Avoid high-risk correction cycles
- ✅ Backtested data from the last 20+ years