November 09, 2025 a 03:12 pm


Retail Stocks - Performance Analysis
The retail sector has demonstrated a varied performance across different timeframes. The fluctuations highlight shifting dynamics influenced by market sensitivities and consumer behavior. Identifying outperformers and laggards provides indicators for strategic positioning. This analysis delves into the performance of major retail equities over the past week, month, and quarter.
📊 Retail Stocks Performance One Week
| Stock | Performance (%) | Performance |
|---|---|---|
| TJX | 3.15 | |
| WMT | 1.40 | |
| COST | 1.27 | |
| DG | 0.75 | |
| AMZN | 0.21 | |
| ULTA | -0.35 | |
| TGT | -1.49 | |
| LOW | -2.08 | |
| HD | -2.22 | |
| JD | -3.81 |
📊 Retail Stocks Performance One Month
| Stock | Performance (%) | Performance |
|---|---|---|
| AMZN | 12.91 | |
| TGT | 6.82 | |
| TJX | 3.07 | |
| WMT | 0.95 | |
| LOW | 0.52 | |
| DG | 0.38 | |
| JD | 0.18 | |
| ULTA | -5.73 | |
| HD | -1.13 | |
| COST | -0.64 |
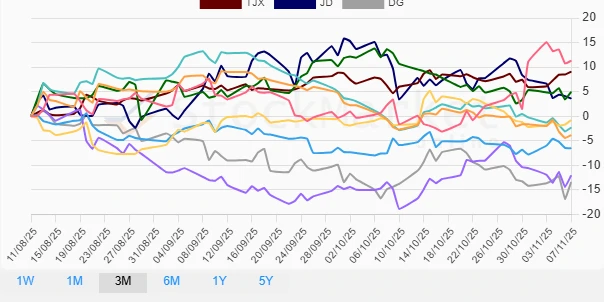
📊 Retail Stocks Performance Three Months
| Stock | Performance (%) | Performance |
|---|---|---|
| AMZN | 11.29 | |
| TJX | 9.07 | |
| ULTA | 4.96 | |
| JD | 3.59 | |
| DG | -13.42 | |
| TGT | -12.06 | |
| COST | -6.52 | |
| LOW | -2.32 | |
| HD | -3.87 | |
| WMT | -0.81 |
✅ Summary
Throughout the examined periods, the retail sector shows a clear divergence in performance among key stocks. TJX and AMZN consistently outperform, showing robust growth potential and favorable market conditions. In contrast, stocks like JD and DG face challenges, indicated by consistent underperformance. Strategic investment should consider these trends, with stronger consideration for stocks demonstrating resilience. The data supports a diversified but cautious portfolio approach, leveraging well-performing stocks while monitoring underperforming equities for potential turnaround opportunities.
Smart Data Insight
Master the Perfect Entry & Exit for this Stock
Don't leave your profits to chance. Historically, this stock follows specific seasonal patterns that institutional traders use to maximize returns.
- ✅ Identify the "Golden Buying Window"
- ✅ Avoid high-risk correction cycles
- ✅ Backtested data from the last 20+ years