
August 09, 2026 a 03:12 pm


Retail Stocks - Performance Analysis
The retail sector has shown a distinctive performance over recent periods, with significant variances in stock performance across specific timeframes. Short-term fluctuation and long-term growth metrics present both risk and opportunity. This analysis provides insights into the top-performing stocks and those that have underperformed, offering a strategic overview for investors.
📊 Retail Stocks Performance One Week
In the past week, retail stocks have exhibited varied performances. Notably, ULTA emerged as a top-performer, gaining an impressive 9.93%, followed closely by LOW and HD. The sector shows resilience despite moderate dips from companies like COST and JD.
| Stock | Performance (%) | Performance |
|---|---|---|
| ULTA | 9.93 | |
| LOW | 7.31 | |
| HD | 6.98 | |
| TGT | 3.61 | |
| TJX | 2.54 | |
| AMZN | 1.22 | |
| WMT | 0.59 | |
| JD | -0.10 | |
| DG | -0.35 | |
| COST | -0.42 |
📊 Retail Stocks Performance One Month
In the monthly frame, ULTA's stock skyrocketed with a 19.01% increase, undoubtedly leading the retail pack. JD and TGT followed, showing robust returns. Despite these gains, WMT posted a noted decline of 1.66%, highlighting some sector vulnerability amid broader market conditions.
| Stock | Performance (%) | Performance |
|---|---|---|
| ULTA | 19.01 | |
| JD | 15.86 | |
| TGT | 10.50 | |
| AMZN | 12.74 | |
| DG | 6.83 | |
| TJX | 6.53 | |
| LOW | 5.77 | |
| HD | 3.84 | |
| COST | 3.51 | |
| WMT | -1.66 |
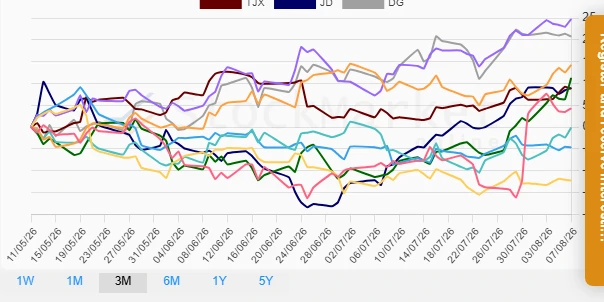
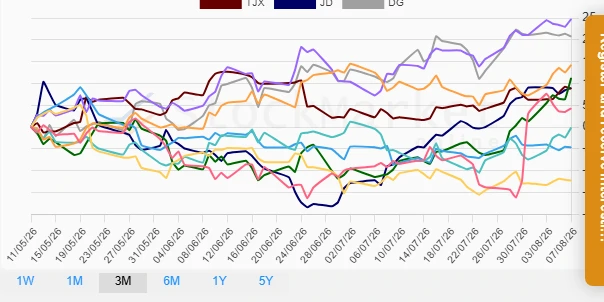
📊 Retail Stocks Performance Three Months
Over a three-month period, TGT has dominated with a remarkable 24.77% return, reflecting strategic positioning and growth potential. DG and HD also showcase commendable performance, while WMT faced the largest decline in this timeframe, signaling challenges within its current operational strategy.
| Stock | Performance (%) | Performance |
|---|---|---|
| TGT | 24.77 | |
| DG | 20.73 | |
| HD | 14.25 | |
| ULTA | 11.25 | |
| JD | 8.94 | |
| TJX | 8.81 | |
| AMZN | 4.29 | |
| LOW | -0.12 | |
| COST | -4.66 | |
| WMT | -12.25 |
🔍 Summary
The retail sector displays a dynamic range of performances across different timeframes. ULTA consistently stands out as a top performer, especially in shorter time frames. However, the disparity in WMT's performance over three months underscores potential risks for investors. Strategic stock selection and diversification remain key. Investors should keep an eye on sector developments and company-specific news impacting these stocks. A balanced approach with a careful review of market trends is recommended for portfolio stability and growth.
Smart Data Insight
Master the Perfect Entry & Exit for this Stock
Don't leave your profits to chance. Historically, this stock follows specific seasonal patterns that institutional traders use to maximize returns.
- ✅ Identify the "Golden Buying Window"
- ✅ Avoid high-risk correction cycles
- ✅ Backtested data from the last 20+ years