
March 08, 2026 a 03:12 pm


Retail Stocks - Performance Analysis
In this comprehensive analysis, we delve deep into the performance of major retail sector stocks over various timeframes. Observing these patterns helps identify both prevailing trends and potential investment opportunities. We will explore detailed performance metrics spanning from one week to three months, highlighting both outperformers and laggards across the industry. This report aims to provide valuable insights for informed investment decisions.
Retail Stocks Performance One Week 📊
| Stock | Performance (%) | Performance |
|---|---|---|
| TGT | 6.19 | |
| JD | 2.09 | |
| AMZN | 1.63 | |
| TJX | -1.42 | |
| COST | -1.21 | |
| WMT | -3.22 | |
| LOW | -4.85 | |
| ULTA | -5.75 | |
| HD | -6.10 | |
| DG | -6.47 |
Retail Stocks Performance One Month 📊
| Stock | Performance (%) | Performance |
|---|---|---|
| TGT | 4.80 | |
| TJX | 2.35 | |
| AMZN | 1.63 | |
| DG | 0.00 | |
| COST | -0.12 | |
| JD | -3.45 | |
| WMT | -5.42 | |
| ULTA | -6.31 | |
| HD | -7.13 | |
| LOW | -9.68 |
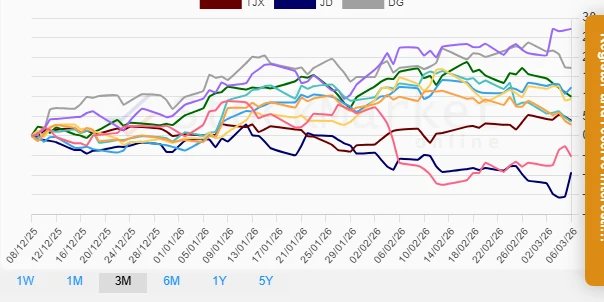
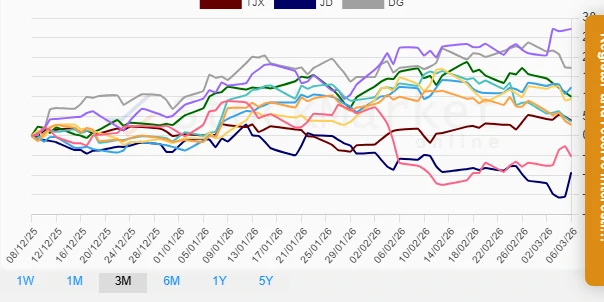
Retail Stocks Performance Three Months 📊
| Stock | Performance (%) | Performance |
|---|---|---|
| TGT | 27.23 | |
| DG | 17.30 | |
| COST | 12.29 | |
| ULTA | 9.98 | |
| WMT | 9.41 | |
| TJX | 3.91 | |
| LOW | 3.62 | |
| HD | 2.82 | |
| AMZN | -5.24 | |
| JD | -9.32 |
Summary 📝
The retail sector continues to demonstrate significant variability, influenced by a range of consumer spending patterns and macroeconomic dynamics. Target (TGT) has shown remarkable resilience, especially over a three-month horizon, leading its peers with a substantial 27.23% increase. On the other hand, Dollar General (DG) displayed contrasting short-term underperformance yet impressively recovered in the longer 3-month span. Home improvement giants like Home Depot (HD) face challenges, particularly over monthly evaluations. Investors should carefully consider these trends and sector dynamics, as sharp disparities might offer both risks and opportunities, depending on one's investment strategy.
Smart Data Insight
Master the Perfect Entry & Exit for this Stock
Don't leave your profits to chance. Historically, this stock follows specific seasonal patterns that institutional traders use to maximize returns.
- ✅ Identify the "Golden Buying Window"
- ✅ Avoid high-risk correction cycles
- ✅ Backtested data from the last 20+ years