June 08, 2025 a 03:12 pm


Retail Stocks - Performance Analysis
In the dynamic realm of retail stocks, this analysis delves into the performance over distinct periods of one week, one month, and three months. Through a structured comparison, we identify exemplary performers and underperformers, alongside unveiling overarching trends and potential risks. The insights herein provide a basis for strategic investment decisions, capturing both opportunities and areas of concern.
📊 Retail Stocks Performance One Week
| Stock | Performance (%) | Performance |
|---|---|---|
| DG | 16.59% | |
| AMZN | 4.14% | |
| TGT | 3.60% | |
| JD | 2.23% | |
| TJX | 1.23% | |
| LOW | -0.19% | |
| HD | -0.25% | |
| ULTA | -1.22% | |
| WMT | -1.26% | |
| COST | -2.37% |
📊 Retail Stocks Performance One Month
| Stock | Performance (%) | Performance |
|---|---|---|
| DG | 23.03% | |
| ULTA | 18.08% | |
| AMZN | 10.54% | |
| LOW | 1.56% | |
| TGT | 1.53% | |
| HD | 1.43% | |
| COST | 0.89% | |
| WMT | 0.85% | |
| TJX | 0.48% | |
| JD | -1.50% |
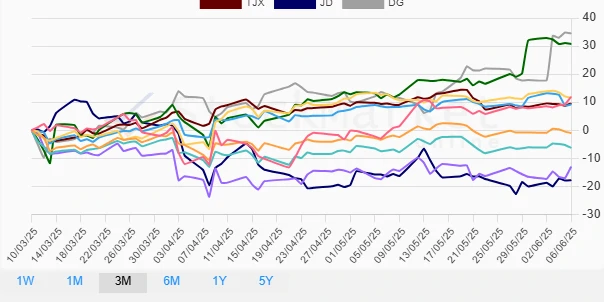
📊 Retail Stocks Performance Three Months
| Stock | Performance (%) | Performance |
|---|---|---|
| DG | 34.49% | |
| ULTA | 30.76% | |
| AMZN | 11.93% | |
| WMT | 11.57% | |
| TJX | 9.59% | |
| COST | 9.18% | |
| HD | -1.02% | |
| LOW | -6.26% | |
| TGT | -13.00% | |
| JD | -17.85% |
Summary
This comprehensive insight into retail stock performance reveals some compelling patterns. Dollar General (DG) consistently emerges as a fortified leader across all timeframes, marking it as an attractive proposition for investors. Ulta Beauty (ULTA) further offers promising returns, especially over the longer durations. On the downside, JD.com (JD) remains consistently underwhelming, particularly over three months. This analysis underscores the vitality of maintaining a diversified portfolio and the necessity of continual market monitoring to harness emergent opportunities and mitigate risks proactively.
Smart Data Insight
Master the Perfect Entry & Exit for this Stock
Don't leave your profits to chance. Historically, this stock follows specific seasonal patterns that institutional traders use to maximize returns.
- ✅ Identify the "Golden Buying Window"
- ✅ Avoid high-risk correction cycles
- ✅ Backtested data from the last 20+ years