
February 08, 2026 a 03:12 pm


Retail Stocks - Performance Analysis
📊 In a volatile market environment, the retail sector exhibits strong signs of divergence in performance. Analyzing the latest data across different timelines helps in identifying emerging trends and making informed decisions. This comprehensive analysis showcases the performance of major retail stocks, highlighting top performers and underperformers across one week, one month, and three months to provide deeper insights into sector momentum.
Retail Stocks Performance One Week
🕵️♂️ Over the past week, Walmart and Target exhibited notable strength with increases of 9.81% and 9.38% respectively, standing out against the broader retail landscape. Amazon, on the other hand, experienced a significant decline of -12.59%, highlighting potential pressures or sector-specific challenges.
| Stock | Performance (%) | Performance |
|---|---|---|
| WMT | 9.81 | |
| TGT | 9.38 | |
| ULTA | 6.49 | |
| COST | 6.34 | |
| LOW | 4.18 | |
| TJX | 3.99 | |
| HD | 2.81 | |
| DG | 2.34 | |
| JD | -1.37 | |
| AMZN | -12.59 |
Retail Stocks Performance One Month
📈 In the monthly analysis, Walmart, with a performance increase of 13.84%, and Target, with a 9.59% increase, continue their robust performance, while Amazon remains under pressure with a -15.74% decrease. The continuous positive trajectory of these stocks reflects consumer confidence and strategic initiatives driving growth.
| Stock | Performance (%) | Performance |
|---|---|---|
| WMT | 13.84 | |
| TGT | 9.59 | |
| COST | 8.07 | |
| LOW | 4.30 | |
| ULTA | 3.81 | |
| DG | 3.07 | |
| HD | 2.89 | |
| TJX | -1.14 | |
| JD | -4.44 | |
| AMZN | -15.74 |
Retail Stocks Performance Three Months
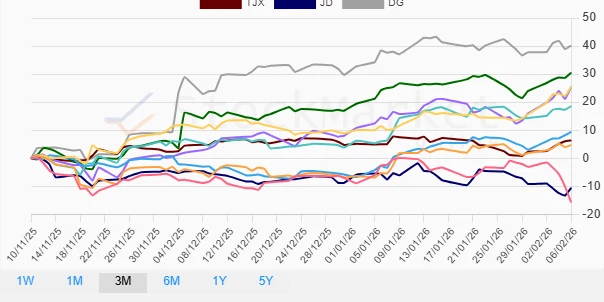
📉 Over the past three months, significant gains were observed in Dollar General and Ulta Beauty with 40.15% and 30.51% increases respectively. In contrast, Amazon and JD faced declines, reflecting ongoing industry challenges. This period underscores the mixed performance landscape within the retail sector.
| Stock | Performance (%) | Performance |
|---|---|---|
| DG | 40.15 | |
| ULTA | 30.51 | |
| WMT | 25.50 | |
| TGT | 25.38 | |
| LOW | 18.58 | |
| COST | 9.41 | |
| TJX | 6.36 | |
| HD | 4.71 | |
| JD | -10.53 | |
| AMZN | -15.66 |
Summary
💡 The retail sector exhibits mixed performance across different timeframes with robust outputs from companies like Dollar General, Ulta Beauty, and Walmart. These stocks demonstrate resilience and strategic acumen that outpace broader sector challenges. Conversely, Amazon and JD highlight potential risks and market pressures. The information provides a comprehensive perspective for investors to gauge potential opportunities and adjust strategies for optimized returns in this evolving market landscape.
Smart Data Insight
Master the Perfect Entry & Exit for this Stock
Don't leave your profits to chance. Historically, this stock follows specific seasonal patterns that institutional traders use to maximize returns.
- ✅ Identify the "Golden Buying Window"
- ✅ Avoid high-risk correction cycles
- ✅ Backtested data from the last 20+ years