December 07, 2025 a 03:12 pm


Retail Stocks - Performance Analysis
📊 The retail sector has shown varied dynamics across different timescales, reflecting shifting consumer behaviors and market conditions. While certain stocks have outperformed significantly, others remain under pressure due to broader economic challenges. This analysis explores the performance over the past week, month, and three months, highlighting key movers and providing strategic insights.
Retail Stocks Performance One Week
| Stock | Performance (%) | Performance |
|---|---|---|
| DG | 20.02% | |
| ULTA | 11.78% | |
| WMT | 4.11% | |
| LOW | 2.47% | |
| TGT | 1.75% | |
| TJX | 0.92% | |
| JD | 0.24% | |
| HD | -0.61% | |
| AMZN | -1.59% | |
| COST | -2.05% |
Retail Stocks Performance One Month
| Stock | Performance (%) | Performance |
|---|---|---|
| DG | 30.16% | |
| ULTA | 16.01% | |
| WMT | 11.85% | |
| LOW | 6.69% | |
| TJX | 5.97% | |
| TGT | 1.45% | |
| COST | -2.98% | |
| HD | -4.09% | |
| JD | -5.93% | |
| AMZN | -6.01% |
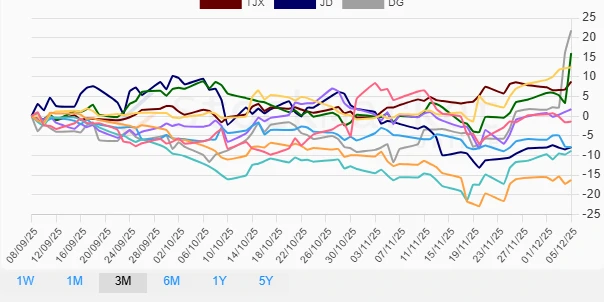
Retail Stocks Performance Three Months
| Stock | Performance (%) | Performance |
|---|---|---|
| DG | 21.82% | |
| ULTA | 16.04% | |
| WMT | 12.43% | |
| TJX | 8.79% | |
| TGT | 1.76% | |
| AMZN | -1.37% | |
| COST | -7.87% | |
| JD | -7.91% | |
| LOW | -8.84% | |
| HD | -16.25% |
Summary
✅ The retail sector demonstrates a mixed performance, with distinctive outliers both positive and negative. Dollar General (DG) consistently shows robust growth across all three periods, establishing itself as a standout performer. Conversely, Home Depot (HD) faces significant pressure, especially over the three-month period, indicating potential challenges in the home improvement segment. Broadly, the sector reveals pockets of opportunity characterized by varying performances that reflect distinct retail strategies and market positions. Investors should consider diversified strategies to leverage the gains in outperforming stocks while cautiously monitoring underperformers for long-term opportunities.