
September 06, 2026 a 03:11 pm


Retail Stocks - Performance Analysis
📊 The retail sector has seen considerable volatility across various stocks with both significant gains and losses over different timeframes. Keeping an eye on the evolving dynamics can provide opportunities for strategic investment decisions as both top performers and underperformers present unique insights.
Retail Stocks Performance One Week
🔍 In the past week, the retail sector experienced a diverse range of performances with ULTA leading the pack with an impressive 8.72% gain, followed closely by DG at 8.18%. Conversely, COST exhibited the highest losses, retreating by 3.18%. A detailed performance analysis highlights strategic positioning opportunities amid varying market conditions.
| Stock | Performance (%) | Performance |
|---|---|---|
| ULTA | 8.72% | |
| DG | 8.18% | |
| WMT | 3.91% | |
| TGT | 0.79% | |
| JD | -1.64% | |
| LOW | -1.69% | |
| TJX | -2.26% | |
| HD | -2.76% | |
| AMZN | -2.96% | |
| COST | -3.18% |
Retail Stocks Performance One Month
🔍 Over the past month, TGT posted a remarkable 9.78% increase, marking it as the top performer. On the other side, TJX saw a substantial decline of 19.77%, reflecting possible concerns or corrections in its share value. These mixed results highlight the ongoing recalibration within the sector.
| Stock | Performance (%) | Performance |
|---|---|---|
| TGT | 9.78% | |
| DG | 5.50% | |
| ULTA | 0.42% | |
| COST | -3.28% | |
| WMT | -3.70% | |
| LOW | -8.68% | |
| AMZN | -5.72% | |
| HD | -10.04% | |
| JD | -14.89% | |
| TJX | -19.77% |
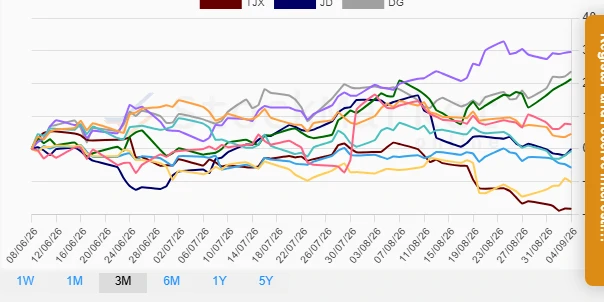
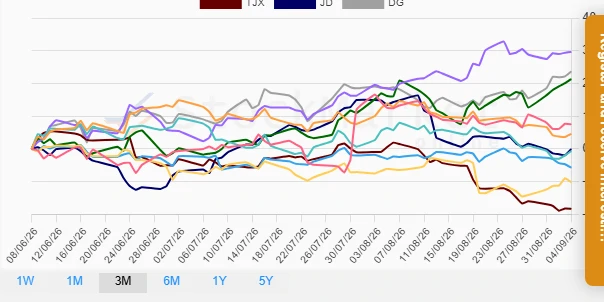
Retail Stocks Performance Three Months
🔍 TGT led the three-month performance with an outstanding 29.65% gain, underlining strong sector-specific growth. DG followed with 23.66%. Conversely, TJX saw declines of 18.27%, indicating market or strategic challenges. These figures suggest robust growth potential yet call for cautious navigation.
| Stock | Performance (%) | Performance |
|---|---|---|
| TGT | 29.65% | |
| DG | 23.66% | |
| ULTA | 21.35% | |
| AMZN | 7.53% | |
| HD | 4.57% | |
| LOW | -0.68% | |
| JD | -0.05% | |
| COST | -5.71% | |
| WMT | -10.16% | |
| TJX | -18.27% |
Summary
💡 Across these periods, TGT emerges as a robust performer, indicating a strong market position and strategic advances. Conversely, TJX's persistent underperformance underscores potential risks or strategic realignments. Retail investors should consider these patterns for future portfolio adjustments, balanced by macroeconomic cues and individual company strategies.
Smart Data Insight
Master the Perfect Entry & Exit for this Stock
Don't leave your profits to chance. Historically, this stock follows specific seasonal patterns that institutional traders use to maximize returns.
- ✅ Identify the "Golden Buying Window"
- ✅ Avoid high-risk correction cycles
- ✅ Backtested data from the last 20+ years