October 05, 2025 a 03:12 pm


Retail Stocks - Performance Analysis
Retail stocks have displayed varying performances over recent periods, both reflecting investor sentiment and underlying economic conditions. This analysis provides a thorough evaluation of recent trends. By contrasting short and medium-term fluctuations, we glean insights into potential shifts within the sector. Key observations and potential implications are detailed below.
📊 Retail Stocks Performance One Week
| Stock | Performance (%) | Performance |
|---|---|---|
| JD | 2.71% | |
| TGT | 1.36% | |
| ULTA | 0.82% | |
| COST | -0.05% | |
| AMZN | -0.09% | |
| WMT | -1.07% | |
| TJX | -1.22% | |
| DG | -1.79% | |
| HD | -3.72% | |
| LOW | -4.26% |
📊 Retail Stocks Performance One Month
| Stock | Performance (%) | Performance |
|---|---|---|
| JD | 12.56% | |
| ULTA | 7.95% | |
| WMT | 1.60% | |
| TJX | 1.52% | |
| COST | -5.01% | |
| TGT | -4.38% | |
| AMZN | -5.47% | |
| HD | -5.81% | |
| DG | -8.30% | |
| LOW | -9.05% |
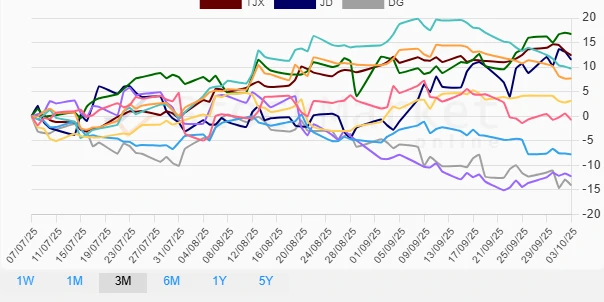
📊 Retail Stocks Performance Three Months
| Stock | Performance (%) | Performance |
|---|---|---|
| ULTA | 16.75% | |
| LOW | 9.69% | |
| TJX | 12.40% | |
| JD | 11.50% | |
| HD | 7.66% | |
| WMT | 3.15% | |
| AMZN | -0.75% | |
| COST | -7.75% | |
| TGT | -12.23% | |
| DG | -14.05% |
🔍 Summary
The analysis of these prominent retail stocks over distinct periods unveils certain patterns and market responses. Short-term weekly fluctuations were led by JD, demonstrating resilience amidst considerable dips by other market giants like HD and LOW. Observing the monthly data, JD continued its strong performance, closely followed by ULTA, signifying robust investor confidence. Over the quarter, ULTA soared, suggesting strong market fundamentals and possibly bullish investor sentiment surrounding its performance outlook. Overall, while certain stocks showed relative stability, significant volatility emphasizes a need for cautious optimism in the retail sector.
Smart Data Insight
Master the Perfect Entry & Exit for this Stock
Don't leave your profits to chance. Historically, this stock follows specific seasonal patterns that institutional traders use to maximize returns.
- ✅ Identify the "Golden Buying Window"
- ✅ Avoid high-risk correction cycles
- ✅ Backtested data from the last 20+ years