
October 04, 2026 a 03:12 pm


Retail Stocks - Performance Analysis
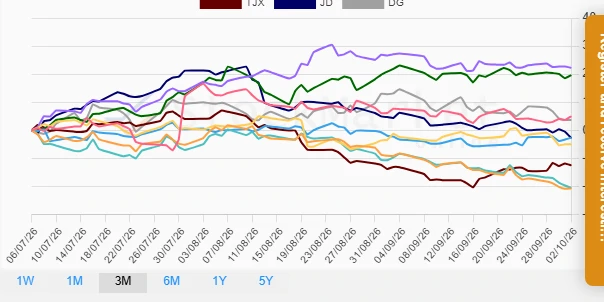
In this analysis, we delve into the performance of major retail sector stocks over three distinct time periods. The objective is to identify top performers and underperformers, discern notable patterns, and provide professional insights into the retail equities landscape. As volatility prevails in the market, our focus remains on capturing the intricate dynamics within the retail sector over the past week, month, and quarter.
Retail Stocks Performance One Week 📊
During the one-week period, TJX emerged as the top performer with a gain of 2.06%, whereas DG witnessed the most significant drop of -4.80%. This week's data highlights the retail sector's mixed performance amidst variable consumer demands and market conditions. Careful analysis of these fluctuating trends is essential for strategic asset allocation.
| Stock | Performance (%) | Performance |
|---|---|---|
| TJX | 2.06 | |
| AMZN | 0.77 | |
| COST | -0.21 | |
| ULTA | -0.26 | |
| TGT | -0.91 | |
| JD | -2.74 | |
| WMT | -3.46 | |
| HD | -3.57 | |
| LOW | -4.57 | |
| DG | -4.80 |
Retail Stocks Performance One Month 🔍
Over the one-month horizon, TJX continued to show resilience with a positive performance of 0.70%, contrasting with HD, which faced a notable downturn of -12.49%. This timeframe underscores the varying degrees of susceptibility to macroeconomic factors influencing retail equities.
| Stock | Performance (%) | Performance |
|---|---|---|
| TJX | 0.70 | |
| COST | 0.63 | |
| AMZN | -2.56 | |
| WMT | -2.59 | |
| ULTA | -3.47 | |
| TGT | -5.07 | |
| JD | -9.03 | |
| DG | -10.95 | |
| LOW | -12.15 | |
| HD | -12.49 |
Retail Stocks Performance Three Months 📈
Over the three-month period, TGT achieved a remarkable gain of 22.24%, along with significant positive movement from ULTA at 19.62%. Conversely, HD and LOW both encountered substantial declines. This timeframe reflects robust performances for certain retail stocks, potentially driven by strategic initiatives and seasonal factors.
| Stock | Performance (%) | Performance |
|---|---|---|
| TGT | 22.24 | |
| ULTA | 19.62 | |
| AMZN | 4.96 | |
| DG | 3.68 | |
| COST | -2.69 | |
| JD | -2.78 | |
| WMT | -5.03 | |
| TJX | -12.50 | |
| LOW | -20.56 | |
| HD | -20.75 |
Summary 💡
Throughout the observed periods, TJX and TGT proved to be strong contenders within the retail sector with commanding performances. In contrast, HD and DG experienced significant downturns, highlighting the volatility that currently pervades the market. Investors should remain vigilant and assess broader economic indicators when navigating the retail sector, optimizing portfolios to account for potential fluctuations and capitalizing on emerging opportunities.
Smart Data Insight
Master the Perfect Entry & Exit for this Stock
Don't leave your profits to chance. Historically, this stock follows specific seasonal patterns that institutional traders use to maximize returns.
- ✅ Identify the "Golden Buying Window"
- ✅ Avoid high-risk correction cycles
- ✅ Backtested data from the last 20+ years