
January 04, 2026 a 03:12 pm



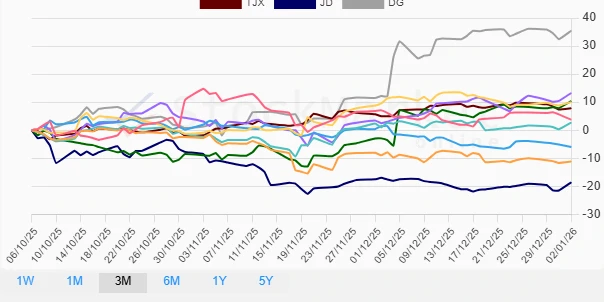
Retail Stocks - Performance Analysis
Welcome to the comprehensive performance analysis of retail stocks over various time periods. This report takes a deep dive into the recent market trends ranging from one week to three months, capturing key performers and laggards in the sector. Utilizing detailed metrics, this analysis aims to provide valuable insights for investors navigating the volatile retail space.
Retail Stocks Performance One Week
📊 The weekly performance analysis reveals a challenging landscape for retail stocks. Although some investments showed resilience, the general sentiment was mixed. Notably, ULTA leads the short-term gains with a noticeable positive trend, while AMZN and COST diverged as significant underperformers. This volatility marks a possible shift in consumer priorities or external market factors. Careful monitoring is essential.
| Stock | Performance (%) | Performance |
|---|---|---|
| ULTA | 2.07 | |
| TGT | 1.01 | |
| LOW | 1.01 | |
| WMT | 0.92 | |
| JD | 0.51 | |
| DG | -0.67 | |
| HD | -1.14 | |
| TJX | -1.81 | |
| COST | -2.17 | |
| AMZN | -2.60 |
Retail Stocks Performance One Month
🗣️ Over the past month, the focus shifts dramatically. With TGT and DG surfacing as top contenders, the month's analysis conveys strategic movements potentially influenced by seasonal consumer patterns. COST, however, registers a significant decline, punctuated by the deepest monthly drop, indicative of potential operational or macroeconomic challenges. Collective retail trends reflect both caution and aggression in market approaches.
| Stock | Performance (%) | Performance |
|---|---|---|
| TGT | 8.84 | |
| DG | 3.78 | |
| ULTA | 3.19 | |
| TJX | 0.70 | |
| LOW | -0.54 | |
| JD | -1.13 | |
| AMZN | -1.22 | |
| WMT | -1.95 | |
| HD | -2.41 | |
| COST | -4.51 |
Retail Stocks Performance Three Months
📈 The quarterly review offers a revealing perspective on strategic positioning within the retail sector. DG emerges as the dominant performer with a substantial increase, overshadowing peers and suggesting potent market penetration strategies or product leverage. Despite WMT and ULTA's remarkable showings, JD records the steepest decline, raising concerns about geopolitical or industry-specific challenges affecting its trajectory.
| Stock | Performance (%) | Performance |
|---|---|---|
| DG | 35.47 | |
| TGT | 13.27 | |
| ULTA | 10.36 | |
| WMT | 10.02 | |
| TJX | 7.84 | |
| AMZN | 3.76 | |
| LOW | 2.70 | |
| COST | -6.01 | |
| HD | -11.16 | |
| JD | -18.59 |
Summary
🔍 The recent performance review across differing periods highlights distinct patterns within retail stocks. DG's exceptional quarterly trajectory showcases its advantageous position, whereas TGT appears consistently robust across longer frames. Concerns regarding JD's performance suggest the need for close evaluation of external factors affecting its sector. Investors should appraise the dynamics with a consideration of both market-specific and broader economic indicators to craft informed strategies moving forward.
Smart Data Insight
Master the Perfect Entry & Exit for this Stock
Don't leave your profits to chance. Historically, this stock follows specific seasonal patterns that institutional traders use to maximize returns.
- ✅ Identify the "Golden Buying Window"
- ✅ Avoid high-risk correction cycles
- ✅ Backtested data from the last 20+ years