June 01, 2025 a 03:12 pm


Retail Stocks - Performance Analysis
The retail sector has shown varied performance across different time frames, reflecting both macroeconomic influences and company-specific factors. In this analysis, we will explore the performance of key retail stocks over one week, one month, and three months. Our goal is to identify top performers, underperformers, and overall trends that could inform strategic investment decisions.
Retail Stocks Performance One Week 📈
| Stock | Performance (%) | Performance |
|---|---|---|
| ULTA | 15.42% | |
| COST | 3.15% | |
| WMT | 2.47% | |
| LOW | 2.11% | |
| AMZN | 2.01% | |
| HD | 1.55% | |
| TJX | 0.98% | |
| TGT | -0.25% | |
| JD | -2.68% | |
| DG | -4.11% |
Retail Stocks Performance One Month 📊
| Stock | Performance (%) | Performance |
|---|---|---|
| ULTA | 18.42% | |
| AMZN | 8.07% | |
| DG | 7.98% | |
| COST | 3.25% | |
| HD | 1.19% | |
| WMT | 0.04% | |
| TJX | -1.61% | |
| LOW | -0.44% | |
| TGT | -2.98% | |
| JD | -5.49% |
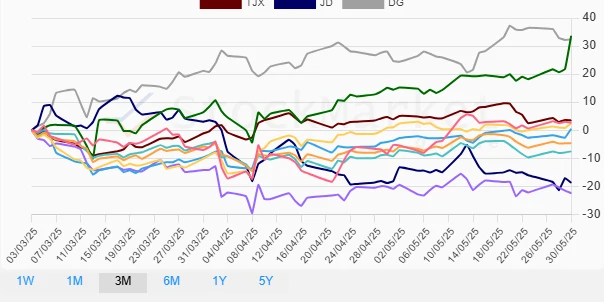
Retail Stocks Performance Three Months 💡
| Stock | Performance (%) | Performance |
|---|---|---|
| ULTA | 33.62% | |
| DG | 32.37% | |
| TJX | 3.50% | |
| AMZN | 2.67% | |
| WMT | 2.47% | |
| COST | 0.46% | |
| HD | -4.67% | |
| JD | -18.70% | |
| LOW | -7.57% | |
| TGT | -22.42% |
Summary 🔍
Over the examined periods, ULTA has consistently outperformed its peers, particularly over the three-month period where it achieved a remarkable 33.62% gain. Meanwhile, TGT has faced significant challenges, reflected in its -22.42% three-month performance. Although variations exist between periods, certain stocks show persistent trends that are valuable for strategic assessment. Investors should continue to monitor these patterns and consider both macroeconomic factors and individual company developments when making investment decisions.
Smart Data Insight
Master the Perfect Entry & Exit for this Stock
Don't leave your profits to chance. Historically, this stock follows specific seasonal patterns that institutional traders use to maximize returns.
- ✅ Identify the "Golden Buying Window"
- ✅ Avoid high-risk correction cycles
- ✅ Backtested data from the last 20+ years