
May 17, 2026 a 12:31 pm


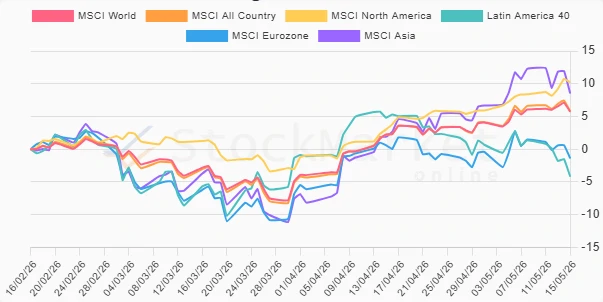
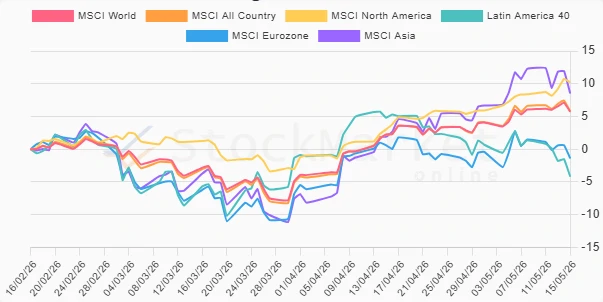
Region - Performance Analysis
📊 Analyzing recent market performances across various global regions gives us insights into economic shifts and investment opportunities. Short-term market movements can often reveal underlying trends in global economic health and sector-based strengths and weaknesses. By assessing the performance over different time horizons like 1 week, 1 month, and 3 months, we can better understand market dynamics and potential implications for future strategies.
Region Performance One Week
🔍 The one-week performance data indicate a mixed market with significant variations. North America stands out with a positive return of 1.85%, signaling resilience or growth in that region. However, Latin America has underperformed substantially, with a decline of -5.54%, possibly affected by economic or political uncertainties. The Eurozone and Asia-Pacific regions also reflected negative trends, further emphasizing a challenging global environment.
| Region | Performance (%) | Performance |
|---|---|---|
| North America | 1.85 | |
| MSCI World | -0.34 | |
| MSCI All Country | -0.82 | |
| MSCI Eurozone | -2.85 | |
| MSCI Asia | -3.73 | |
| Latin America 40 | -5.54 |
Region Performance One Month
📈 Over the past month, markets have shown a stronger performance compared to the previous week. North America again leads the charge with a 5.36% increase, bolstered by possibly robust earnings or economic indicators. The MSCI Asia follows with a 3.96% gain, indicating possible recovery or growth in certain sectors. However, Latin America continues to struggle, reflecting a -9.22% decline, likely driven by external shocks or internal vulnerabilities.
| Region | Performance (%) | Performance |
|---|---|---|
| North America | 5.36 | |
| MSCI Asia | 3.96 | |
| MSCI World | 2.17 | |
| MSCI All Country | 2.17 | |
| MSCI Eurozone | -3.17 | |
| Latin America 40 | -9.22 |
Region Performance Three Months
✅ The three-month horizon shows a more consistent picture for growth, with North America achieving a significant 10.23% performance, signaling robust and sustained growth. The Asia-Pacific region follows with an 8.54% gain, potentially reflecting improved market conditions or reforms. While Latin America shows a -4.17% drop, it is less severe compared to the one-month data, suggesting some stabilization. The Eurozone's minor decline of -1.38% indicates relatively stagnant conditions.
| Region | Performance (%) | Performance |
|---|---|---|
| North America | 10.23 | |
| MSCI Asia | 8.54 | |
| MSCI All Country | 5.80 | |
| MSCI World | 5.72 | |
| MSCI Eurozone | -1.38 | |
| Latin America 40 | -4.17 |
Summary
💡 In summary, North America consistently outperformed other regions across all time frames, signaling robust economic underpinnings or market business conditions. The Asia-Pacific region, although experiencing volatility, showed potential recovery signs, particularly over three months. Conversely, Latin America faced significant challenges, reflected in negative performance across all durations, suggesting underlying economic vulnerabilities. A strategic focus on economically stable regions like North America, with considerations of the dynamic conditions in Asia, may be beneficial while continuously monitoring risk factors in underperforming regions.
Smart Data Insight
Master the Perfect Entry & Exit for this Stock
Don't leave your profits to chance. Historically, this stock follows specific seasonal patterns that institutional traders use to maximize returns.
- ✅ Identify the "Golden Buying Window"
- ✅ Avoid high-risk correction cycles
- ✅ Backtested data from the last 20+ years