
September 06, 2026 a 12:31 pm


Region - Performance Analysis
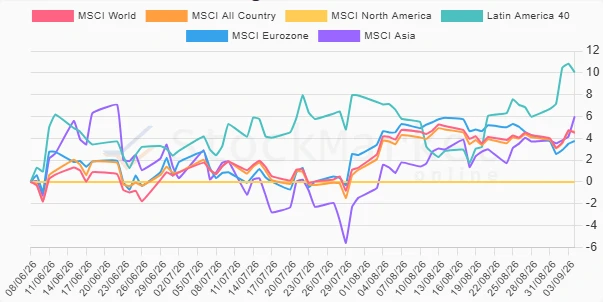
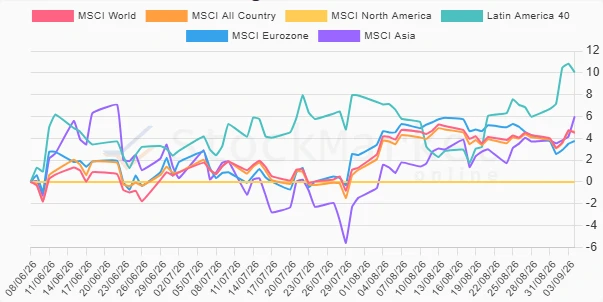
In the ever-evolving landscape of global finance, the performance analysis of geographic regions reveals insightful trends and notable performance metrics over various timeframes. Through this assessment, we aim to provide a comprehensive understanding of market dynamics and significant factors shaping investor sentiment. By analyzing week-long, month-long, and three-month-long performance data, we uncover top performers, identify underperformers, and interpret these results in the context of broader macroeconomic factors.
Region Performance One Week 📅
| Region | Performance (%) | Performance |
|---|---|---|
| Latin America 40 | 4.08 | |
| MSCI Asia | 2.28 | |
| MSCI All Country | 0.51 | |
| MSCI World | 0.20 | |
| MSCI North America | 0.00 | |
| MSCI Eurozone | -0.53 |
Region Performance One Month 🌙
| Region | Performance (%) | Performance |
|---|---|---|
| Latin America 40 | 4.27 | |
| MSCI Asia | 4.20 | |
| MSCI All Country | 0.32 | |
| MSCI North America | 0.00 | |
| MSCI World | -0.27 | |
| MSCI Eurozone | -1.56 |
Region Performance Three Months 📈
| Region | Performance (%) | Performance |
|---|---|---|
| Latin America 40 | 10.06 | |
| MSCI Asia | 5.99 | |
| MSCI All Country | 4.61 | |
| MSCI World | 4.49 | |
| MSCI Eurozone | 3.75 | |
| MSCI North America | 0.00 |
Summary 🔍
Analyzing the performance across different time frames, Latin America emerges as the most consistent top performer, particularly over the three-month period, indicating robust regional growth and investor confidence. MSCI Asia shows strong performance, especially within the recent month, which may be attributed to macroeconomic policies and favorable market conditions. While the MSCI All Country index maintains steady upward trends, the MSCI Eurozone's varied performance reflects potential economic challenges and geopolitical uncertainties impacting investor sentiment. These insights suggest a nuanced approach to regional investment strategies and underscore the importance of diversifying asset allocations to mitigate risks and capitalize on regional strengths.
Smart Data Insight
Master the Perfect Entry & Exit for this Stock
Don't leave your profits to chance. Historically, this stock follows specific seasonal patterns that institutional traders use to maximize returns.
- ✅ Identify the "Golden Buying Window"
- ✅ Avoid high-risk correction cycles
- ✅ Backtested data from the last 20+ years