
September 29, 2026 a 09:32 am


Real Estate Stocks - Performance Analysis
📊 In the last periods, the real estate sector has shown mixed results with noticeable volatility. Recent trends demonstrate frequent fluctuations influenced by macroeconomic factors and sector-specific challenges. Understanding these dynamics is crucial for informed investment strategies.
Real Estate Stocks Performance One Week
| Stock | Performance (%) | Performance |
|---|---|---|
| WELL | 1.13% | |
| SPG | -0.69% | |
| PSA | -1.69% | |
| PLD | -2.55% | |
| EQIX | -4.60% | |
| AMT | -4.16% | |
| DLR | -4.63% | |
| CCI | -7.44% | |
| CBRE | -7.77% | |
| WY | -8.69% |
Real Estate Stocks Performance One Month
| Stock | Performance (%) | Performance |
|---|---|---|
| WELL | -2.06% | |
| EQIX | -2.98% | |
| DLR | -4.29% | |
| SPG | -4.68% | |
| AMT | -4.59% | |
| PLD | -5.93% | |
| PSA | -9.47% | |
| CCI | -12.38% | |
| CBRE | -14.11% | |
| WY | -17.85% |
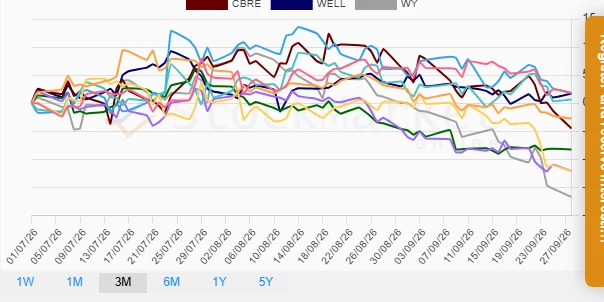
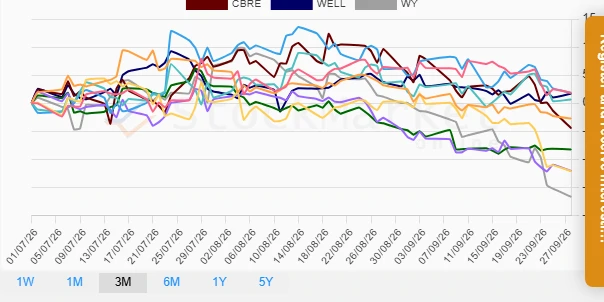
Real Estate Stocks Performance Three Months
| Stock | Performance (%) | Performance |
|---|---|---|
| AMT | 1.86% | |
| DLR | 1.82% | |
| WELL | 1.70% | |
| EQIX | 0.66% | |
| PLD | -2.74% | |
| CBRE | -4.46% | |
| SPG | -8.25% | |
| PSA | -12.06% | |
| CCI | -12.13% | |
| WY | -16.69% |
Summary
💡 Over the past three months, the real estate sector has faced significant headwinds, reflected in widespread negative performances. Weyerhaeuser (WY) and CBRE Group (CBRE) have emerged as consistent underperformers, indicative of broader challenges in the sector. Conversely, stocks like WELL, albeit with minor gains, show resilience. Investors should remain cautious and strategic, focusing on long-term growth drivers and portfolio diversity to navigate ongoing market uncertainties effectively.
Smart Data Insight
Master the Perfect Entry & Exit for this Stock
Don't leave your profits to chance. Historically, this stock follows specific seasonal patterns that institutional traders use to maximize returns.
- ✅ Identify the "Golden Buying Window"
- ✅ Avoid high-risk correction cycles
- ✅ Backtested data from the last 20+ years