April 28, 2026 a 09:32 am


Real Estate Stocks - Performance Analysis
The real estate sector has experienced variable performance across different time frames, reflective of market volatility and investor sentiment shifts. This analysis captures the notable fluctuations in stock performances, highlighting the top gainers and those experiencing downturns. As we delve into weekly, monthly, and quarterly performances, the data reveals divergent trends that warrant further exploration to optimize investment strategies.
📊 Real Estate Stocks Performance One Week
| Stock | Performance (%) | Performance |
|---|---|---|
| WELL | 1.88 | |
| WY | 0.53 | |
| AMT | 0.34 | |
| EQIX | -0.39 | |
| PSA | -0.89 | |
| PLD | -1.33 | |
| CCI | -1.67 | |
| SPG | -1.69 | |
| CBRE | -2.37 | |
| DLR | -2.46 |
📊 Real Estate Stocks Performance One Month
| Stock | Performance (%) | Performance |
|---|---|---|
| PSA | 14.10 | |
| EQIX | 12.52 | |
| DLR | 11.45 | |
| SPG | 11.22 | |
| CBRE | 10.69 | |
| PLD | 8.47 | |
| WELL | 7.25 | |
| CCI | 6.39 | |
| WY | 4.98 | |
| AMT | 3.61 |
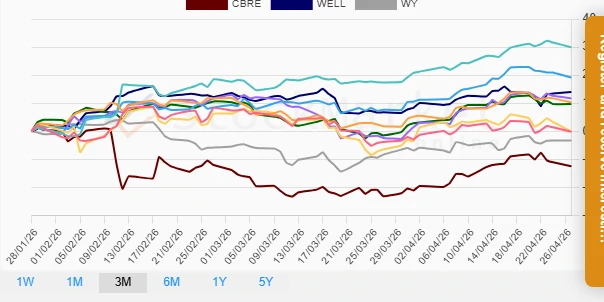
📊 Real Estate Stocks Performance Three Months
| Stock | Performance (%) | Performance |
|---|---|---|
| EQIX | 29.92 | |
| DLR | 19.13 | |
| WELL | 14.01 | |
| PSA | 11.71 | |
| PLD | 10.25 | |
| SPG | 9.72 | |
| AMT | -0.21 | |
| CCI | -0.07 | |
| WY | -3.34 | |
| CBRE | -12.47 |
🗣️ Summary
The analysis of the real estate sector over varying time frames points towards a broadly positive sentiment with key outperformers including EQIX and PSA, particularly in longer-term assessments. While short-term volatility was evident, long-term performance was robust for these stocks, suggesting potential resilience in market conditions. Investors are advised to monitor these trends closely, balance their portfolios with top performers, and cautiously assess underperformers like CBRE which currently faces headwinds.