May 27, 2025 a 09:32 am


Real Estate Stocks - Performance Analysis
🏢📊 The real estate sector has exhibited varying performance trends over the short to medium term, reflecting the dynamic nature of market forces and investor sentiments. Over the past week, stocks have generally trended downwards, while the one-month performance indicates a recovery, particularly for some major players. However, the three-month period reveals mixed results, posing potential challenges and opportunities for stakeholders.
Real Estate Stocks Performance One Week
📉 The past week has seen significant headwinds in the real estate sector, with negative returns being the dominating theme. The greatest decline was observed in CBRE, which was down by 5.59%, marking a notable underperformance in response to broader market pressures. Notably, DLR was the stock least affected by the market downturn, even though it still recorded a negative return at -1.18%.
| Stock | Performance (%) | Performance |
|---|---|---|
| CBRE | -5.59 | |
| PLD | -4.33 | |
| SPG | -3.82 | |
| WY | -3.73 | |
| PSA | -3.61 | |
| CCI | -2.70 | |
| AMT | -1.64 | |
| EQIX | -1.40 | |
| WELL | -1.32 | |
| DLR | -1.18 |
Real Estate Stocks Performance One Month
📈 A contrasting picture emerges over the one-month horizon, where the real estate sector has shown resilience and signs of recovery. DLR surged to the top, gaining 5.07%, evidencing investor confidence. EQIX and PSA also demonstrated significant upward movement, contributing positively to sector dynamics.
| Stock | Performance (%) | Performance |
|---|---|---|
| DLR | 5.07 | |
| EQIX | 3.07 | |
| PSA | 2.14 | |
| PLD | 1.99 | |
| WY | 1.96 | |
| WELL | 1.70 | |
| AMT | 0.91 | |
| CBRE | 0.74 | |
| SPG | 0.51 | |
| CCI | 0.28 |
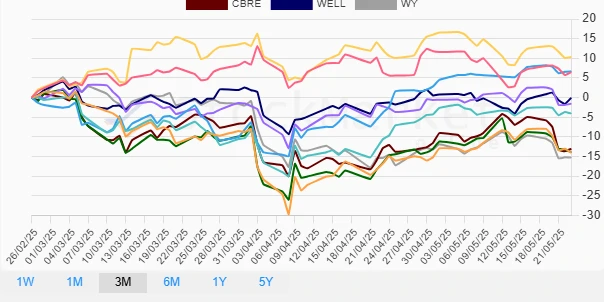
Real Estate Stocks Performance Three Months
🔍 The three-month period presents a mixed bag for the sector, with stocks generally reflecting macroeconomic uncertainties. Notably, WY experienced the sharpest decline at -15.29%, highlighting potential sector risks. Conversely, DLR and AMT showcased resilience, with appreciations of 6.67% and 6.50%, respectively, hinting at selective investor optimism.
| Stock | Performance (%) | Performance |
|---|---|---|
| WY | -15.29 | |
| PLD | -14.04 | |
| SPG | -13.92 | |
| CBRE | -13.07 | |
| EQIX | -4.03 | |
| PSA | -1.56 | |
| WELL | -0.08 | |
| DLR | 6.67 | |
| AMT | 6.50 | |
| CCI | 10.32 |
Summary
💡 In summary, the real estate sector shows a nuanced landscape characterized by fluctuating performance across different time horizons. The short-term downside pressure has been offset by pockets of growth in the one-month period, while the quarterly analysis points to continued volatility. Investors should tailor strategies to capture opportunities in both the immediate recovery potentials and the long-term fundamentals within the sector. Prudent stock selection, aligned with macro trends, remains paramount in navigating this complex environment.
Smart Data Insight
Master the Perfect Entry & Exit for this Stock
Don't leave your profits to chance. Historically, this stock follows specific seasonal patterns that institutional traders use to maximize returns.
- ✅ Identify the "Golden Buying Window"
- ✅ Avoid high-risk correction cycles
- ✅ Backtested data from the last 20+ years