June 24, 2025 a 09:32 am


Real Estate Stocks - Performance Analysis
The real estate sector has shown significant fluctuations across different time frames. This analysis covers the one-week, one-month, and three-month performances of major real estate stocks, highlighting key drivers behind market trends and providing insights into sector dynamics. Given the global economic conditions, real estate continues to face both challenges and opportunities, making it crucial for investors to remain informed.
📊 Real Estate Stocks Performance One Week
| Stock | Performance (%) | Performance |
|---|---|---|
| CBRE | 4.74% | |
| CCI | 3.73% | |
| AMT | 3.00% | |
| WY | 2.73% | |
| PLD | 1.93% | |
| WELL | 1.49% | |
| SPG | 1.24% | |
| DLR | 0.73% | |
| PSA | 0.39% | |
| EQIX | 0.36% |
📊 Real Estate Stocks Performance One Month
| Stock | Performance (%) | Performance |
|---|---|---|
| CBRE | 13.68% | |
| WY | 5.39% | |
| DLR | 5.40% | |
| WELL | 3.38% | |
| EQIX | 3.08% | |
| AMT | 4.59% | |
| PLD | 3.01% | |
| CCI | 2.40% | |
| SPG | 1.51% | |
| PSA | -0.57% |
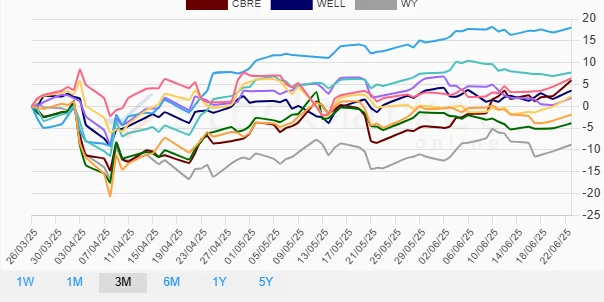
📊 Real Estate Stocks Performance Three Months
| Stock | Performance (%) | Performance |
|---|---|---|
| DLR | 18.01% | |
| EQIX | 7.74% | |
| AMT | 6.42% | |
| CBRE | 5.90% | |
| WELL | 3.60% | |
| CCI | 2.28% | |
| PSA | 1.90% | |
| PLD | -1.94% | |
| SPG | -3.90% | |
| WY | -8.80% |
🔍 Summary
Across all evaluated time frames, CBRE consistently shows strong positive returns, reflecting potential robust strategic positioning and market conditions. Over the three-month period, DLR stands out with the highest growth, suggesting a significant investment interest or strategic moves favoring its growth. Conversely, WY has demonstrated the most volatility with notable declines over the same period, indicating potential sector-specific challenges or broader economic impacts. Investors should consider these trends in conjunction with broader economic data to better position their portfolios within the real estate sector.
Smart Data Insight
Master the Perfect Entry & Exit for this Stock
Don't leave your profits to chance. Historically, this stock follows specific seasonal patterns that institutional traders use to maximize returns.
- ✅ Identify the "Golden Buying Window"
- ✅ Avoid high-risk correction cycles
- ✅ Backtested data from the last 20+ years