
June 23, 2026 a 09:32 am


Real Estate Stocks - Performance Analysis
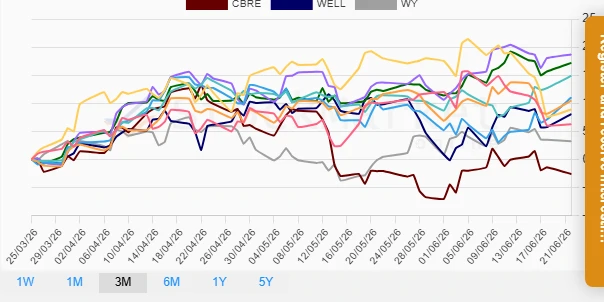
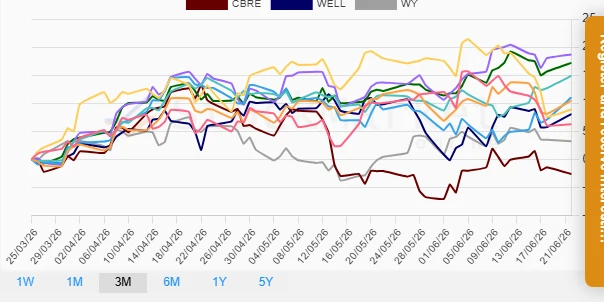
The real estate sector shows significant performance variations across different timeframes. Within one week, mixed results dominate with both gains and losses, while the one-month outlook displays a slightly more positive trend. Over the three months period, substantial rebounds indicate potential positive momentum driven by key performers. Let's delve deeper into the data to uncover trends and investment opportunities.
Real Estate Stocks Performance One Week 📊
Over the past week, the real estate sector has shown mixed results. While some stocks like DLR and EQIX posted modest gains, others such as CCI and AMT experienced declines. This period has been marked by volatility possibly due to macroeconomic factors affecting the broader market. Here is a detailed breakdown of this week's performance:
| Stock | Performance (%) | Performance |
|---|---|---|
| DLR | 2.73 | |
| EQIX | 1.95 | |
| PSA | 0.06 | |
| SPG | -0.27 | |
| WELL | -0.89 | |
| PLD | -1.49 | |
| WY | -2.19 | |
| CBRE | -4.09 | |
| AMT | -4.39 | |
| CCI | -5.72 |
Real Estate Stocks Performance One Month 📈
During the last month, performance improved notably as several stocks registered positive gains, notably SPG and PSA. This suggests a potential shift in market sentiment or advantageous sector dynamics during this period. The data reflects the following month-long performance:
| Stock | Performance (%) | Performance |
|---|---|---|
| SPG | 5.01 | |
| PSA | 4.99 | |
| EQIX | 3.47 | |
| WY | 2.74 | |
| DLR | 2.14 | |
| CBRE | -0.53 | |
| PLD | -1.18 | |
| WELL | -1.76 | |
| AMT | -3.77 | |
| CCI | -9.11 |
Real Estate Stocks Performance Three Months 📉
Over the last three months, key stocks such as PSA, SPG, and EQIX showcased significant rebounds, potentially driven by improved investor confidence or sector-specific news. Conversely, CBRE trailed behind with negative returns. Here is a comprehensive overview of the three-month performance:
| Stock | Performance (%) | Performance |
|---|---|---|
| PSA | 18.69 | |
| SPG | 17.18 | |
| EQIX | 14.86 | |
| DLR | 11.01 | |
| PLD | 10.44 | |
| CCI | 8.87 | |
| WELL | 8.05 | |
| AMT | 6.24 | |
| WY | 3.20 | |
| CBRE | -2.62 |
Summary 🗣️
In summary, the real estate sector has evidenced both volatility and recovery across the analyzed periods. The weekly data suggests short-term fluctuations driving mixed results, while the monthly data reflects stabilization with a hint of positive trajectory. The three-month analysis highlights a potential return to strength, especially driven by stocks like PSA and SPG. As market conditions continue to evolve, investors should closely monitor macroeconomic indicators and sector-specific developments to make informed decisions.
Smart Data Insight
Master the Perfect Entry & Exit for this Stock
Don't leave your profits to chance. Historically, this stock follows specific seasonal patterns that institutional traders use to maximize returns.
- ✅ Identify the "Golden Buying Window"
- ✅ Avoid high-risk correction cycles
- ✅ Backtested data from the last 20+ years