
September 22, 2026 a 09:32 am


Real Estate Stocks - Performance Analysis
📊 The Real Estate sector has shown varied performance in recent weeks and months, reflecting mixed investor sentiment amidst economic uncertainties. The fluctuations in stock values over the defined periods indicate both challenges and opportunities within the sector. Our analysis explores the top gainers and laggards, highlighting key trends and market dynamics.
Real Estate Stocks Performance One Week
✅ Over the past week, Equinix (EQIX) emerged as the top performer with a remarkable rise of 4.94%, indicating strong investor confidence. On the downside, Weyerhaeuser (WY) saw a significant drop of 5.86%, reflecting potential sector-specific challenges or broader market conditions affecting timber REITs. The mixed results showcase a variety of market influences in play over the short term.
| Stock | Performance (%) | Performance |
|---|---|---|
| EQIX | 4.94 | |
| DLR | 3.91 | |
| CBRE | 2.23 | |
| SPG | 0.43 | |
| WELL | 0.03 | |
| PSA | 0.03 | |
| PLD | 0.01 | |
| CCI | -0.03 | |
| AMT | -1.75 | |
| WY | -5.86 |
Real Estate Stocks Performance One Month
📉 In the last month, the Real Estate sector faced challenges, with Weyerhaeuser (WY) and Public Storage (PSA) recording significant declines of 14.94% and 8.21%, respectively. The overall negative sentiment may be attributed to macroeconomic pressures, including interest rate hikes affecting asset valuations. No stock recorded a positive performance, highlighting a bearish trend over this period.
| Stock | Performance (%) | Performance |
|---|---|---|
| WY | -14.94 | |
| PSA | -8.21 | |
| SPG | -6.16 | |
| CBRE | -5.62 | |
| PLD | -4.19 | |
| WELL | -2.65 | |
| CCI | -2.92 | |
| DLR | -1.95 | |
| AMT | -0.52 | |
| EQIX | -0.50 |
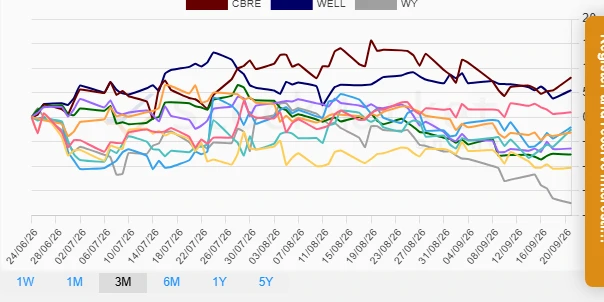
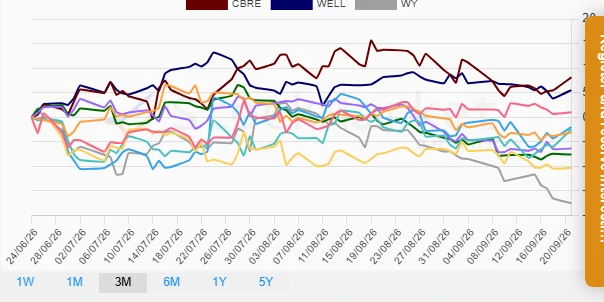
Real Estate Stocks Performance Three Months
⚠️ Over the three-month horizon, significant variances in performance are notable, with CBRE gaining 8.1% as a top performer in stark contrast to Weyerhaeuser's (WY) steep decline of 17.53%. This volatility illustrates the fluctuating conditions within the sector, potentially influenced by broader economic adversities as well as company-specific developments impacting stock valuations.
| Stock | Performance (%) | Performance |
|---|---|---|
| CBRE | 8.10 | |
| WELL | 5.51 | |
| AMT | 1.00 | |
| DLR | -2.04 | |
| EQIX | -2.52 | |
| PLD | -3.12 | |
| PSA | -6.37 | |
| SPG | -7.62 | |
| CCI | -10.28 | |
| WY | -17.53 |
Summary
🔍 The performance of Real Estate stocks over the indicated periods reflects a challenging environment, with a diverse range of results. Stocks such as CBRE emerged favorably, while others grappled with declines, notably Weyerhaeuser due to potential sector-specific challenges. As market dynamics continue to evolve, investors should focus on a diversified approach, considering both macroeconomic factors and specific company fundamentals when evaluating opportunities within the Real Estate sector.
Smart Data Insight
Master the Perfect Entry & Exit for this Stock
Don't leave your profits to chance. Historically, this stock follows specific seasonal patterns that institutional traders use to maximize returns.
- ✅ Identify the "Golden Buying Window"
- ✅ Avoid high-risk correction cycles
- ✅ Backtested data from the last 20+ years