
October 20, 2026 a 09:32 am


Real Estate Stocks - Performance Analysis
In the recent assessment of the real estate sector, notable fluctuations have been observed across prominent stocks over varied timeframes. The analysis focuses significantly on contrasting shifts over one week, one month, and three months. These metrics offer insight into economic impacts influencing the sector and provide direction for investor strategy. This comprehensive breakdown will highlight key performers and laggards, aiding in informed decision-making.
Real Estate Stocks Performance One Week 📊
The real estate sector displayed mixed performance this week. Top performers include PSA, AMT, and CCI, gaining momentum with positive returns. PLD faced the most significant setback this week, impacting overall sector sentiment. The insights call for cautious optimism, as certain stocks reveal resilience amidst volatility.
| Stock | Performance (%) | Performance |
|---|---|---|
| PSA | 2.54% | |
| AMT | 2.02% | |
| CCI | 1.92% | |
| WELL | 1.46% | |
| WY | 1.27% | |
| CBRE | 1.00% | |
| SPG | 0.96% | |
| DLR | -2.85% | |
| EQIX | -4.34% | |
| PLD | -7.27% |
Real Estate Stocks Performance One Month 📊
Over the past month, the sector has experienced heightened volatility. CCI distinguished itself as a dominant positive performer amidst broader downtrend tendencies affecting PLD and WY. Investors need to closely monitor sector dynamics as trends suggest both opportunities and risks in equal measure over the short term.
| Stock | Performance (%) | Performance |
|---|---|---|
| CCI | 11.74% | |
| AMT | 5.65% | |
| WELL | 2.14% | |
| PSA | -0.08% | |
| SPG | -1.31% | |
| DLR | -4.85% | |
| EQIX | -4.32% | |
| CBRE | -6.04% | |
| PLD | -8.13% | |
| WY | -9.65% |
Real Estate Stocks Performance Three Months 📊
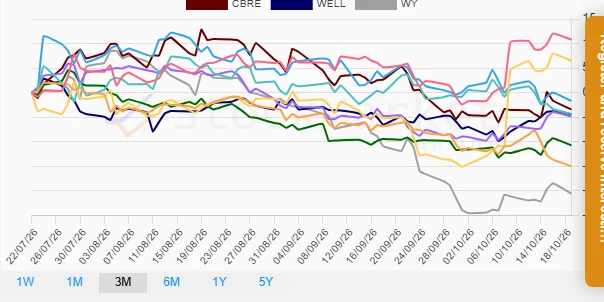
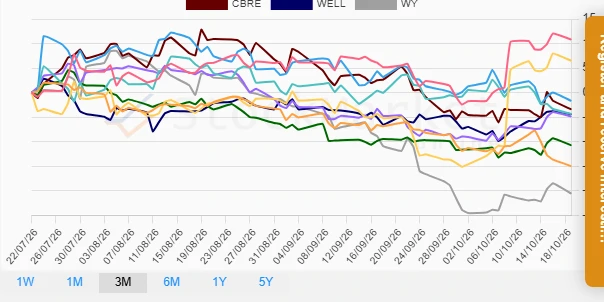
The three-month performance reveals significant downward pressure across the sector, led by substantial negative returns from WY and PLD. Despite this, AMT and CCI showcased resilience. Understanding the longer-term implications of these trends is vital for aligning investment strategies toward both risk management and opportunity development.
| Stock | Performance (%) | Performance |
|---|---|---|
| AMT | 10.83% | |
| CCI | 6.50% | |
| CBRE | -3.40% | |
| EQIX | -4.36% | |
| DLR | -1.67% | |
| PSA | -4.84% | |
| WELL | -4.38% | |
| SPG | -10.73% | |
| PLD | -14.97% | |
| WY | -20.54% |
Summary 📈
The assessment of the real estate sector reveals that while some firms strive and thrive, others face considerable challenges. Over shorter timeframes, such as a week or month, certain stocks like PSA and CCI exemplify robust performance. Conversely, the three-month horizon underscores substantial hurdles, with stocks like WY and PLD reflecting deeper market stresses. Strategic foresight remains critical, as navigating through this sector’s ebbs demands a balance between recognizing immediate winners and preparing for longer-run volatility.
Smart Data Insight
Master the Perfect Entry & Exit for this Stock
Don't leave your profits to chance. Historically, this stock follows specific seasonal patterns that institutional traders use to maximize returns.
- ✅ Identify the "Golden Buying Window"
- ✅ Avoid high-risk correction cycles
- ✅ Backtested data from the last 20+ years