May 20, 2025 a 09:32 am


Real Estate Stocks - Performance Analysis
In this comprehensive analysis, we assess the performance of major real estate stocks over different time frames. With varying trends and market responses, our goal is to identify top performers and underperformers and deduce implications for potential investors. We explore specific factors impacting these stocks, aiming to offer a concise yet profound understanding of market fluctuations.
📊 Real Estate Stocks Performance One Week
| Stock | Performance (%) | Performance |
|---|---|---|
| AMT | 5.39 | |
| CCI | 4.69 | |
| WELL | 3.69 | |
| DLR | 2.99 | |
| PSA | 2.45 | |
| SPG | 2.24 | |
| EQIX | 1.02 | |
| PLD | 0.90 | |
| CBRE | -0.63 | |
| WY | -0.66 |
📊 Real Estate Stocks Performance One Month
| Stock | Performance (%) | Performance |
|---|---|---|
| DLR | 12.68 | |
| CBRE | 10.71 | |
| EQIX | 10.66 | |
| SPG | 9.42 | |
| PLD | 8.30 | |
| PSA | 4.64 | |
| WY | 2.99 | |
| WELL | 2.50 | |
| CCI | -0.24 | |
| AMT | -2.93 |
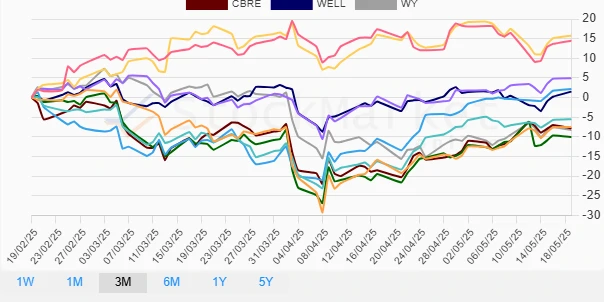
📊 Real Estate Stocks Performance Three Months
| Stock | Performance (%) | Performance |
|---|---|---|
| CCI | 15.75 | |
| AMT | 14.48 | |
| PSA | 4.91 | |
| DLR | 2.17 | |
| WELL | 1.51 | |
| EQIX | -5.53 | |
| WY | -8.29 | |
| CBRE | -7.81 | |
| PLD | -7.52 | |
| SPG | -10.06 |
🔍 Summary
The analysis of real estate stocks over different time frames highlights a dynamic market landscape. Notably, DLR, CBRE, and EQIX performed exceptionally well over the one-month period, indicating potential growth opportunities. Conversely, SPG faced challenges over three months, reflected in its substantial negative performance. This suggests that while the sector shows promise, careful stock selection is essential for optimizing returns. Investors should consider both short-term volatility and long-term growth potential in their decision-making processes.
Smart Data Insight
Master the Perfect Entry & Exit for this Stock
Don't leave your profits to chance. Historically, this stock follows specific seasonal patterns that institutional traders use to maximize returns.
- ✅ Identify the "Golden Buying Window"
- ✅ Avoid high-risk correction cycles
- ✅ Backtested data from the last 20+ years