March 17, 2026 a 09:32 am


Real Estate Stocks - Performance Analysis
The real estate sector has shown a varied performance across different time horizons. Over the short term, movements were apparent but substantially less impactful than those observed over longer periods. Insights gained from the week's data suggest potential adjustments in strategies, while monthly and quarterly performances reveal broader trends influenced by macroeconomic factors. A careful examination of these periods can highlight both emerging opportunities and existing threats.
Real Estate Stocks Performance One Week
| Stock | Performance (%) | Performance |
|---|---|---|
| EQIX | 2.96 | |
| WELL | 1.20 | |
| CBRE | 0.39 | |
| DLR | 0.22 | |
| AMT | -0.71 | |
| CCI | -1.10 | |
| SPG | -1.42 | |
| PLD | -1.50 | |
| WY | -1.77 | |
| PSA | -5.38 |
Real Estate Stocks Performance One Month
| Stock | Performance (%) | Performance |
|---|---|---|
| EQIX | 3.11 | |
| DLR | 0.30 | |
| WELL | -0.10 | |
| CCI | -2.86 | |
| PLD | -3.41 | |
| PSA | -3.42 | |
| AMT | -3.61 | |
| SPG | -3.74 | |
| CBRE | -4.73 | |
| WY | -11.75 |
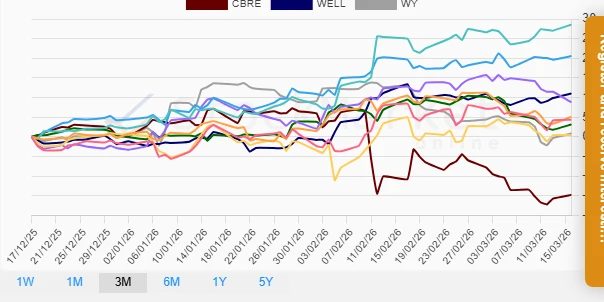
Real Estate Stocks Performance Three Months
| Stock | Performance (%) | Performance |
|---|---|---|
| EQIX | 28.54 | |
| DLR | 20.56 | |
| WELL | 11.01 | |
| PSA | 8.82 | |
| PLD | 5.08 | |
| AMT | 4.33 | |
| SPG | 3.14 | |
| WY | 0.85 | |
| CCI | 0.49 | |
| CBRE | -14.77 |
Summary
Across the real estate sector, performance over a one-week span displays less dramatic shifts compared to the volatility observed over three months. Notably, EQIX consistently outperforms its peers, signifying its robust positioning. Conversely, shares like WY and CBRE have demonstrated notable declines over extended periods, indicating potential vulnerabilities. Investors are advised to remain cautious, closely scrutinizing both macroeconomic indicators and company-specific developments to guide their investment strategies effectively. A diversified approach, prioritizing companies with stable growth and defensive capabilities, appears prudent in navigating current market conditions.
Smart Data Insight
Master the Perfect Entry & Exit for this Stock
Don't leave your profits to chance. Historically, this stock follows specific seasonal patterns that institutional traders use to maximize returns.
- ✅ Identify the "Golden Buying Window"
- ✅ Avoid high-risk correction cycles
- ✅ Backtested data from the last 20+ years