
September 15, 2026 a 09:32 am


Real Estate Stocks - Performance Analysis
📊 The Real Estate sector's performance over recent periods highlights diverse trends across key players. Evaluating data over weekly, monthly, and quarterly durations provides insights into market volatilities and investor sentiment shifts. The analysis identifies top performers and underperformers, offering a comprehensive overview of the sector's dynamics.
Real Estate Stocks Performance One Week
🔍 Over the past week, American Tower (AMT) has shown resilience with a positive performance, while stocks like Digital Realty Trust (DLR) and Equinix (EQIX) dragged on the sector due to significant declines. Market volatility continues to play a pivotal role, affecting equities unevenly across the board.
| Stock | Performance (%) | Performance |
|---|---|---|
| AMT | 0.74 | |
| CBRE | -0.91 | |
| WELL | -1.29 | |
| WY | -2.01 | |
| PSA | -2.05 | |
| CCI | -2.33 | |
| PLD | -2.37 | |
| SPG | -3.25 | |
| EQIX | -4.07 | |
| DLR | -5.46 |
📉 The week underscored DLR's substantial drop, contrasting with AMT's slight gains, suggesting varied investor confidence levels in different real estate sectors.
Real Estate Stocks Performance One Month
🗣️ Monthly data reveals a stark narrative: with American Tower (AMT) barely in the green, many stocks face the pressure of broader market sell-offs. The severe decline in stocks such as Digital Realty Trust (DLR) showcases macroeconomic pressures.
| Stock | Performance (%) | Performance |
|---|---|---|
| AMT | 0.94 | |
| WELL | -0.49 | |
| CCI | -2.24 | |
| PLD | -4.13 | |
| SPG | -6.74 | |
| CBRE | -7.60 | |
| EQIX | -9.64 | |
| PSA | -9.73 | |
| WY | -9.74 | |
| DLR | -10.76 |
📉 The monthly overview shows pressure on the real estate sector, with DLR hitting the bottom, indicating potential overvaluation or macroeconomic stress factors.
Real Estate Stocks Performance Three Months
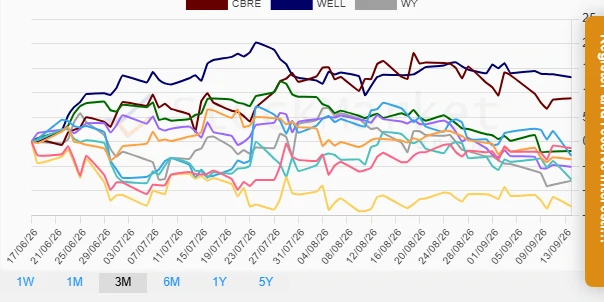
📈 On a quarterly basis, Welltower (WELL) and CBRE Group (CBRE) emerge as leaders, contrasting sharply with stocks like Crown Castle International Corp. (CCI). This data reflects sector rotational trends and investor focus shifts.
| Stock | Performance (%) | Performance |
|---|---|---|
| WELL | 13.14 | |
| CBRE | 8.85 | |
| AMT | -1.32 | |
| SPG | -1.89 | |
| DLR | -2.82 | |
| PSA | -5.12 | |
| PLD | -3.58 | |
| EQIX | -7.66 | |
| WY | -7.97 | |
| CCI | -13.19 |
📉 The quarterly analysis highlights challenges for CCI, facing steep losses, whereas WELL's robust gains suggest strong momentum and sector interest.
Summary
💡 In summary, the performance of real estate stocks varies significantly across different time frames, reflecting underlying market trends and investor sentiment. AMT shows consistent strength over shorter periods, while WELL's quarterly success underscores investor confidence in healthcare-related real estate assets. Conversely, stocks like DLR and CCI exhibit vulnerabilities, potentially due to external economic pressures. Stakeholders should consider these dynamics for strategic allocation decisions in the real estate sector.
Smart Data Insight
Master the Perfect Entry & Exit for this Stock
Don't leave your profits to chance. Historically, this stock follows specific seasonal patterns that institutional traders use to maximize returns.
- ✅ Identify the "Golden Buying Window"
- ✅ Avoid high-risk correction cycles
- ✅ Backtested data from the last 20+ years