January 13, 2026 a 09:32 am


Real Estate Stocks - Performance Analysis
📊 The real estate sector has exhibited varied performance over the past week, month, and three-month periods. While some stocks have surged with impressive returns, others have faced challenges reflected in negative performance figures. This analysis delves into the performance of major real estate stocks, identifying the top performers and underperformers in different time frames.
Real Estate Stocks Performance One Week
| Stock | Performance (%) | Performance |
|---|---|---|
| WY | 7.44 | |
| PSA | 3.30 | |
| PLD | 1.26 | |
| DLR | 0.77 | |
| WELL | 0.55 | |
| CBRE | -0.11 | |
| EQIX | -0.47 | |
| SPG | -0.78 | |
| AMT | -2.38 | |
| CCI | -2.44 |
Real Estate Stocks Performance One Month
| Stock | Performance (%) | Performance |
|---|---|---|
| WY | 10.04 | |
| EQIX | 4.51 | |
| CBRE | 4.48 | |
| DLR | 2.87 | |
| PSA | 1.73 | |
| SPG | 1.58 | |
| WELL | 0.04 | |
| PLD | -0.79 | |
| AMT | -5.05 | |
| CCI | -6.68 |
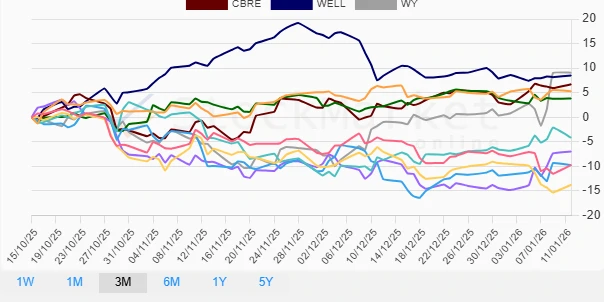
Real Estate Stocks Performance Three Months
| Stock | Performance (%) | Performance |
|---|---|---|
| WELL | 8.48 | |
| WY | 9.07 | |
| CBRE | 6.69 | |
| PLD | 5.27 | |
| SPG | 3.82 | |
| EQIX | -4.18 | |
| PSA | -6.97 | |
| AMT | -9.72 | |
| DLR | -9.78 | |
| CCI | -13.76 |
Summary
🏢 Analysis across the timeframes highlights that Weyerhaeuser (WY) consistently outperformed other stocks, exhibiting significant resilience, especially in the short term. Conversely, Crown Castle International (CCI) showed a markedly negative trend across the observed periods, being the least performer. Notably, the data suggests that diverse external factors could be influencing these outcomes, warranting a nuanced approach to investment decisions in the real estate sector. Hence, while there are opportunities for gains, particularly with well-performing entities like WY, investors should remain vigilant of market dynamics potentially affecting the laggards.