
July 07, 2026 a 09:32 am


Real Estate Stocks - Performance Analysis
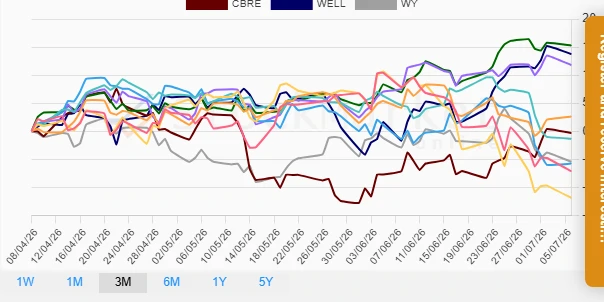
The real estate sector has shown varying market performance across different time frames. Through this analysis, we highlight the top-performing stocks and the significant laggards, providing insights into the market dynamics shaping the sector. Notably, there are clear distinctions between short-term and long-term performance, indicative of industry-specific challenges and opportunities.
📊 Real Estate Stocks Performance One Week
| Stock | Performance (%) | Performance |
|---|---|---|
| CBRE | 4.32 | |
| PLD | 3.45 | |
| WELL | 2.54 | |
| PSA | 1.82 | |
| SPG | 0.61 | |
| AMT | -0.86 | |
| CCI | -1.04 | |
| WY | -2.25 | |
| DLR | -3.30 | |
| EQIX | -4.22 |
📊 Real Estate Stocks Performance One Month
| Stock | Performance (%) | Performance |
|---|---|---|
| WELL | 12.10 | |
| CBRE | 7.40 | |
| SPG | 6.94 | |
| PSA | 4.74 | |
| PLD | -2.77 | |
| WY | -4.20 | |
| DLR | -6.83 | |
| EQIX | -7.62 | |
| AMT | -17.54 | |
| CCI | -22.54 |
📊 Real Estate Stocks Performance Three Months
| Stock | Performance (%) | Performance |
|---|---|---|
| SPG | 15.29 | |
| WELL | 13.76 | |
| PSA | 11.80 | |
| PLD | 2.62 | |
| CBRE | -0.33 | |
| EQIX | -1.33 | |
| DLR | -5.77 | |
| WY | -5.43 | |
| AMT | -7.13 | |
| CCI | -11.88 |
💡 Summary
The real estate sector exhibited a broad range of performances across different periods, highlighting the volatile nature of this market segment. Over the past week, CBRE emerged as the top performer, benefiting perhaps from its diverse real estate services portfolio. However, a substantial decline was observed in stocks such as EQIX. Over the one-month duration, WELL demonstrated significant growth, potentially reflecting strong fundamentals or recent strategic moves. Long-term, over three months, SPG showcased robust gains, possibly hinting at strong retail real estate revitalization. Investors should remain cautious, given the sector's exposure to interest rate fluctuations and macroeconomic variables, with an inclination towards diversified and resilient real estate portfolios being a prudent approach.
Smart Data Insight
Master the Perfect Entry & Exit for this Stock
Don't leave your profits to chance. Historically, this stock follows specific seasonal patterns that institutional traders use to maximize returns.
- ✅ Identify the "Golden Buying Window"
- ✅ Avoid high-risk correction cycles
- ✅ Backtested data from the last 20+ years