May 05, 2026 a 09:31 am


Real Estate Stocks - Performance Analysis
📊 The Real Estate sector has shown mixed performance across different time frames, reflecting various market dynamics and investor sentiments. In the short term, weekly fluctuations were observed due to interest rate expectations and economic data releases. Over the longer monthly and quarterly periods, individual stock performance varies significantly, indicating possible strategic shifts or market reactions to corporate news. A comprehensive analysis follows.
Real Estate Stocks Performance One Week
| Stock | Performance (%) | Performance |
|---|---|---|
| CCI | 4.61 | |
| DLR | 2.06 | |
| AMT | 1.42 | |
| WELL | 1.39 | |
| EQIX | 0.64 | |
| PSA | -0.54 | |
| SPG | -0.58 | |
| PLD | -1.90 | |
| CBRE | -4.74 | |
| WY | -5.27 |
Real Estate Stocks Performance One Month
| Stock | Performance (%) | Performance |
|---|---|---|
| DLR | 9.06 | |
| EQIX | 8.09 | |
| WELL | 7.34 | |
| SPG | 6.73 | |
| CCI | 6.53 | |
| PSA | 5.52 | |
| AMT | 4.32 | |
| PLD | 3.90 | |
| CBRE | 2.81 | |
| WY | -3.48 |
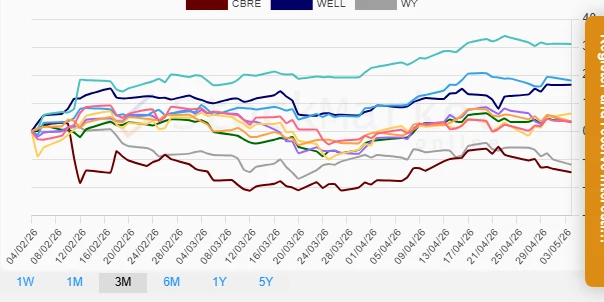
Real Estate Stocks Performance Three Months
| Stock | Performance (%) | Performance |
|---|---|---|
| EQIX | 31.05 | |
| DLR | 18.08 | |
| WELL | 16.55 | |
| CCI | 6.32 | |
| SPG | 3.51 | |
| PLD | 3.46 | |
| AMT | 3.42 | |
| PSA | 3.12 | |
| WY | -11.92 | |
| CBRE | -14.64 |
Summary
💡 The analysis highlights a divergence in the performance of Real Estate stocks across different time frames. Over the short term, some stocks may respond swiftly to microeconomic factors such as interest rate adjustments or policy changes. In contrast, longer-term performance often indicates structural changes within the companies themselves or their response to prolonged market conditions. As such, while stocks like EQIX and DLR show robust growth over the quarter, others like CBRE and WY might be struggling with external pressures or strategic realignments. Investors should consider these variances when making portfolio decisions, potentially balancing high-performance stocks with those experiencing temporary setbacks but holding long-term potential.
Smart Data Insight
Master the Perfect Entry & Exit for this Stock
Don't leave your profits to chance. Historically, this stock follows specific seasonal patterns that institutional traders use to maximize returns.
- ✅ Identify the "Golden Buying Window"
- ✅ Avoid high-risk correction cycles
- ✅ Backtested data from the last 20+ years