
November 03, 2026 a 09:32 am


Real Estate Stocks - Performance Analysis
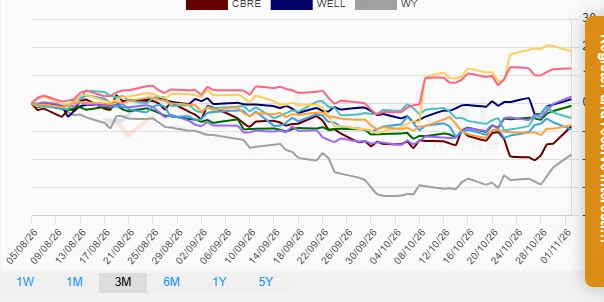
📊 The recent performance of real estate stocks reveals a varied landscape across different time frames. While some stocks have showcased remarkable growth, others have not fared as well. This analysis will dissect the performance metrics over the past week, month, and quarter to provide a comprehensive understanding of the real estate sector's dynamics.
Real Estate Stocks Performance One Week
| Stock | Performance (%) | Performance |
|---|---|---|
| CBRE | 11.98% | |
| WY | 9.55% | |
| PSA | 6.53% | |
| WELL | 5.33% | |
| SPG | 4.40% | |
| PLD | 2.52% | |
| AMT | 2.42% | |
| CURRENT | -0.48% | |
| CCI | -0.94% | |
| DLR | -1.67% |
✅ The one-week analysis highlights CBRE as the top performer, demonstrating dynamic movements within the sector. In contrast, DLR exhibited the most significant negative performance.
Real Estate Stocks Performance One Month
| Stock | Performance (%) | Performance |
|---|---|---|
| CCI | 28.69% | |
| PSA | 16.35% | |
| AMT | 15.60% | |
| WY | 14.67% | |
| SPG | 10.03% | |
| CBRE | 6.16% | |
| WELL | 5.21% | |
| PLD | 0.77% | |
| DLR | -1.11% | |
| EQIX | -2.80% |
📈 Over the one month period, CCI outperforms its peers considerably, revealing potential bullish trends. Conversely, EQIX recorded notable declines, highlighting market shifts.
Real Estate Stocks Performance Three Months
| Stock | Performance (%) | Performance |
|---|---|---|
| CCI | 18.52% | |
| AMT | 12.40% | |
| PSA | 2.29% | |
| WELL | 1.36% | |
| SPG | -1.00% | |
| EQIX | -5.27% | |
| PLD | -7.85% | |
| CBRE | -8.32% | |
| DLR | -9.38% | |
| WY | -18.36% |
⚠️ In the three-month horizon, CCI continues to lead with commendable growth. However, WY's significant decline suggests caution is necessary for stakeholders within this entity.
Summary
💡 In conclusion, the real estate sector exhibits a mixed bag of performances across different time frames. While CCI shows strong upward potential consistently, WY's downturn over three months is a potential red flag. Investors should consider these trends in their equity portfolios, keeping an eye on sector-specific dynamics that could influence future performance.
Smart Data Insight
Master the Perfect Entry & Exit for this Stock
Don't leave your profits to chance. Historically, this stock follows specific seasonal patterns that institutional traders use to maximize returns.
- ✅ Identify the "Golden Buying Window"
- ✅ Avoid high-risk correction cycles
- ✅ Backtested data from the last 20+ years