
February 03, 2026 a 09:32 am


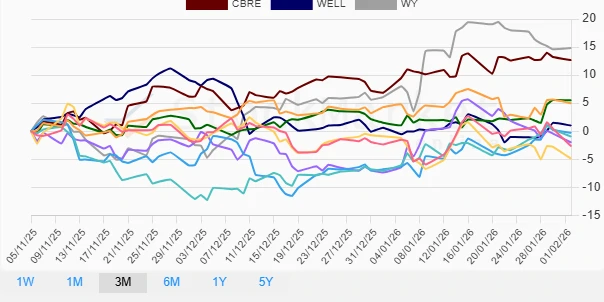

Real Estate Stocks - Performance Analysis
In analyzing the recent market performance, a varied trend can be observed within the Real Estate sector. Short-term fluctuations present opportunities, while broader trends indicate strategic portfolio adjustments. The following analysis provides insights across three different timeframes – one week, one month, and three months – shedding light on standout performances and underperformers in this market segment.
📊 Real Estate Stocks Performance One Week
| Stock | Performance (%) | Performance |
|---|---|---|
| SPG | 3.61% | |
| WELL | 2.15% | |
| DLR | 1.22% | |
| PLD | 0.81% | |
| EQIX | 0.12% | |
| CBRE | -0.02% | |
| WY | -1.50% | |
| CCI | -2.01% | |
| PSA | -2.11% | |
| AMT | -3.51% |
📈 Real Estate Stocks Performance One Month
| Stock | Performance (%) | Performance |
|---|---|---|
| WY | 8.75% | |
| DLR | 6.50% | |
| EQIX | 6.09% | |
| CBRE | 5.81% | |
| PSA | 5.35% | |
| SPG | 3.98% | |
| PLD | 0.69% | |
| WELL | 0.36% | |
| AMT | -0.31% | |
| CCI | -4.00% |
📉 Real Estate Stocks Performance Three Months
| Stock | Performance (%) | Performance |
|---|---|---|
| WY | 14.84% | |
| CBRE | 12.67% | |
| SPG | 5.51% | |
| PLD | 4.98% | |
| WELL | 1.00% | |
| DLR | -0.29% | |
| EQIX | -0.96% | |
| AMT | -2.66% | |
| PSA | -2.01% | |
| CCI | -4.91% |
✅ Summary
The real estate sector's performance presents both challenges and opportunities, with significant variation observed across different time frames. Over the past week, Simon Property Group (SPG) demonstrated strong resilience, while a consistent upward trend over the past month is noted in Weyerhaeuser (WY) and Digital Realty (DLR). Over the three-month horizon, Weyerhaeuser (WY) stands out as a leader amidst high volatility. Investors may consider these stocks for potential gains, while caution is advised for stocks like Crown Castle (CCI), which encountered notable downturns across various periods. Constant re-evaluation of asset allocation and market conditions is recommended for optimal portfolio strategy.
Smart Data Insight
Master the Perfect Entry & Exit for this Stock
Don't leave your profits to chance. Historically, this stock follows specific seasonal patterns that institutional traders use to maximize returns.
- ✅ Identify the "Golden Buying Window"
- ✅ Avoid high-risk correction cycles
- ✅ Backtested data from the last 20+ years