
September 01, 2026 a 09:31 am

Real Estate Stocks - Performance Analysis
📊 The real estate sector showcases a complex picture of performance variations across different time horizons. In the short term, investors are witnessing prevalent challenges, while certain stocks demonstrate strong resilience over quarterly evaluations. This analysis aims to uncover these trends, provide insights, and distill professional perspectives on real estate investments.
Real Estate Stocks Performance One Week
| Stock | Performance (%) | Performance |
|---|---|---|
| CCI | -0.18% | |
| AMT | -1.59% | |
| WELL | -2.05% | |
| PLD | -2.40% | |
| EQIX | -2.48% | |
| SPG | -3.07% | |
| CBRE | -3.87% | |
| DLR | -3.50% | |
| WY | -4.40% | |
| PSA | -4.92% |
 Performance overview displaying weekly challenges faced by real estate stocks.
Real Estate Stocks Performance One Month
| Stock | Performance (%) | Performance |
|---|---|---|
| EQIX | 2.86% | |
| AMT | 1.56% | |
| WELL | 0.92% | |
| CCI | 0.06% | |
| CBRE | -0.19% | |
| DLR | -1.34% | |
| PLD | -3.20% | |
| WY | -6.62% | |
| PSA | -5.36% | |
| SPG | -7.63% |
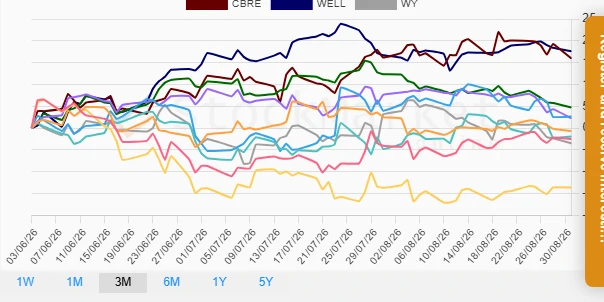 A comparative look at the monthly stock performance indicates variability and the emergence of positive trends.
Real Estate Stocks Performance Three Months
| Stock | Performance (%) | Performance |
|---|---|---|
| WELL | 17.63% | |
| CBRE | 15.97% | |
| SPG | 4.72% | |
| DLR | 2.64% | |
| PSA | 2.27% | |
| PLD | -0.69% | |
| EQIX | -1.92% | |
| AMT | -2.49% | |
| WY | -3.47% | |
| CCI | -13.61% |
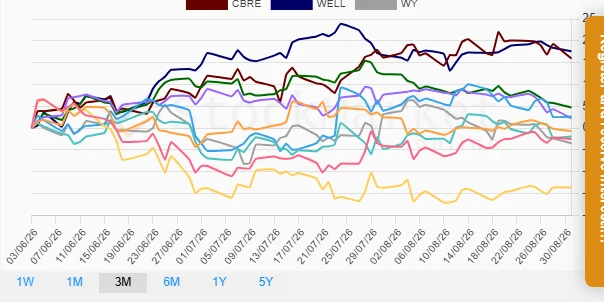 Long-term quarterly insights reveal positive trajectories for certain prominent real estate stocks.
Summary
✅ In summary, the real estate sector is characterized by a notable divergence of performance across various time frames. Over a weekly period, negative yields were widespread, highlighting ongoing market headwinds. However, the one-month and three-month windows illustrated emerging recoveries, particularly with outstanding performances from WELL and CBRE. Investors are encouraged to approach these equities with a keen understanding of sector-specific drivers and to remain vigilant about prevailing economic indicators that could influence future performance.
Smart Data Insight
Master the Perfect Entry & Exit for this Stock
Don't leave your profits to chance. Historically, this stock follows specific seasonal patterns that institutional traders use to maximize returns.
- ✅ Identify the "Golden Buying Window"
- ✅ Avoid high-risk correction cycles
- ✅ Backtested data from the last 20+ years