
June 23, 2026 a 06:00 pm

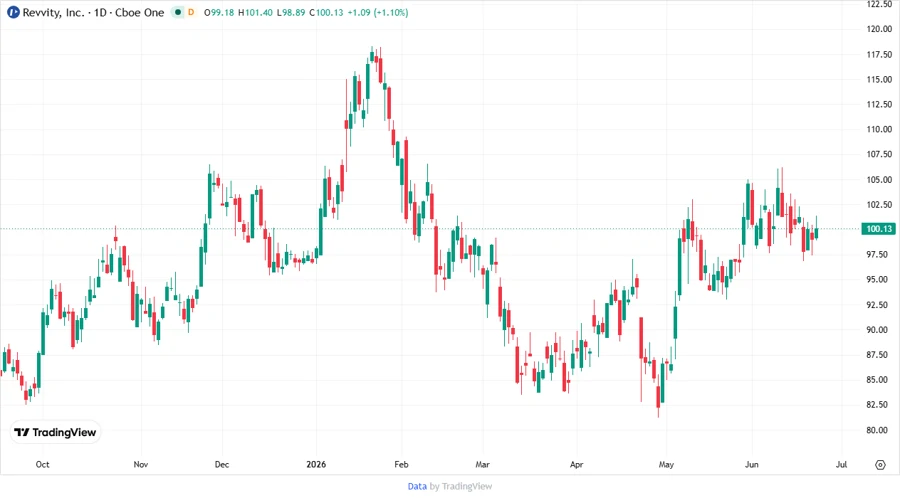
RVTY: Fundamental Ratio Analysis - Revvity, Inc.
Revvity, Inc. operates in the evolving healthcare industry, specializing in diagnostics and life sciences solutions. With a focus on technological advancement and diverse sector services, it offers attractive potential for investors. However, market volatility and sector-specific risks should be considered.
Fundamental Rating
Revvity, Inc. demonstrates a solid fundamental standing, reflected in its ratings across multiple financial metrics.
| Category | Score | Visualization |
|---|---|---|
| Discounted Cash Flow | 4 | |
| Return on Equity | 3 | |
| Return on Assets | 4 | |
| Debt to Equity | 2 | |
| Price to Earnings | 1 | |
| Price to Book | 4 |
Historical Rating
An analysis of past scores reveals consistent performance in financial metrics.
| Date | Overall | DCF | ROE | ROA | Debt/Equity | P/E | P/B |
|---|---|---|---|---|---|---|---|
| 2026-06-23 | 3 | 4 | 3 | 4 | 2 | 1 | 4 |
| N/A | 0 | 4 | 3 | 4 | 2 | 1 | 4 |
Analyst Price Targets
The analyst's price targets suggest a promising upward trajectory with a balanced outlook.
| High | Low | Median | Consensus |
|---|---|---|---|
| $124 | $95 | $111 | $109.83 |
Analyst Sentiment
Analyst recommendations indicate a predominantly favorable outlook for Revvity, Inc.
| Recommendation | Count | Visualization |
|---|---|---|
| Strong Buy | 0 | |
| Buy | 15 | |
| Hold | 14 | |
| Sell | 0 | |
| Strong Sell | 0 |
Conclusion
Revvity, Inc. presents a compelling investment opportunity with a robust market position in diagnostics and life sciences. The company's consistent fundamental ratings and positive analyst targets support a favorable outlook. However, investors should remain cautious of inherent sector risks and ensure portfolio diversification. Overall, Revvity's innovation-driven approach and strategic market positioning make it a potential candidate for growth-oriented portfolios.
Smart Data Insight
Master the Perfect Entry & Exit for this Stock
Don't leave your profits to chance. Historically, this stock follows specific seasonal patterns that institutional traders use to maximize returns.
- ✅ Identify the "Golden Buying Window"
- ✅ Avoid high-risk correction cycles
- ✅ Backtested data from the last 20+ years