December 13, 2025 a 10:15 am
RVTY: Fibonacci Analysis - Revvity, Inc.
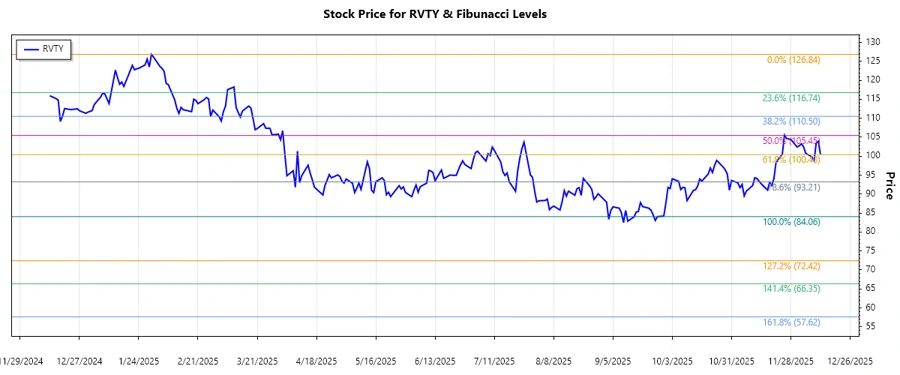
Revvity, Inc., formerly known as PerkinElmer, Inc., has shown variability in its stock performance, affected by the broader challenges in the life sciences and diagnostics markets. Recent trends indicate a notable recovery potential, with technical signals suggesting a promising outlook. Strategic positioning in diagnostics and analytical solutions could support this upward momentum.
Fibonacci Analysis
| Detail | Information |
|---|---|
| Trend Start Date | 2025-03-10 |
| Trend End Date | 2025-12-12 |
| High Point | $126.84 on 2025-01-30 |
| Low Point | $84.06 on 2025-09-25 |
| Fibonacci Level | Price Level |
|---|---|
| 0.236 | $94.77 |
| 0.382 | $100.25 |
| 0.5 | $105.45 |
| 0.618 | $110.65 |
| 0.786 | $117.02 |
Current price $100.49 suggests it is within the 0.382 Fibonacci Retracement level, indicating potential support at $100.25. This suggests a possible reversal or continuation signal, contributing to strategizing entry or exit points.
Conclusion
Revvity, Inc.'s stock showcases robust recovery signals, driven by strategic shifts and positive industry outlooks. While potential support at the 0.382 Fibonacci level offers opportunity, market volatility remains a key risk. The diagnostics sector's growth and innovation edge are promising for long-term investments, given the market leadership positions held. This analysis can aid investors in gauging the right entry points, anticipating reversals or continuations.