October 21, 2025 a 10:15 am
RVTY: Fibonacci Analysis - Revvity, Inc.
Revvity, Inc., having undergone a name change from PerkinElmer, operates robustly in the diagnostics and life sciences sectors. With its innovative products and services, the company positions itself well in the global market. Recent stock trends show resilience, indicating investor confidence and potential for future growth. However, volatility remains a factor to watch as markets are influenced by broader economic conditions.
Fibonacci Analysis
| Start Date | End Date | High Price | High Date | Low Price | Low Date |
|---|---|---|---|---|---|
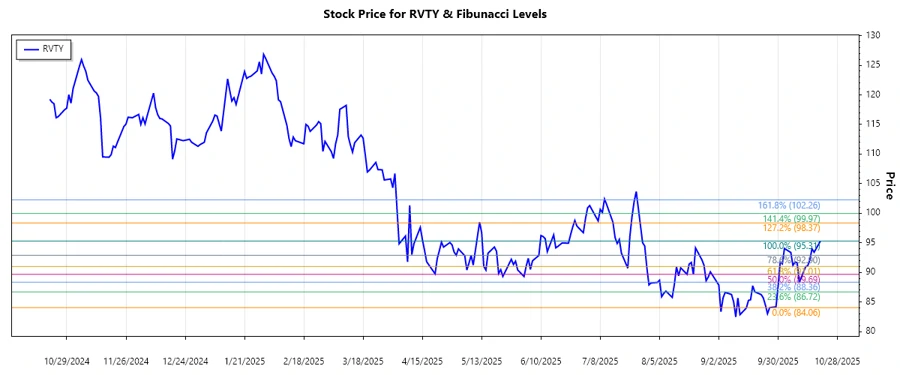
| 2025-08-25 | 2025-10-20 | 95.31 | 2025-10-20 | 84.06 | 2025-09-26 |
| Fibonacci Level | Price Level |
|---|---|
| 0.236 | 87.09 |
| 0.382 | 88.75 |
| 0.5 | 89.69 |
| 0.618 | 90.64 |
| 0.786 | 92.17 |
The current price is at $95.31, exceeding all Fibonacci retracement levels, indicating a potential continuation of an upward trend. This suggests that previously established resistance levels could now function as support, potentially bolstering further gains if market sentiment remains positive.
Conclusion
The RVTY stock has shown a strong rebound from its lows, suggesting resilience and positive investor sentiment. With current pricing above key Fibonacci levels, investors may see potential for continued growth. Nevertheless, caution is warranted due to potential external economic pressures. Analysts should closely monitor for any signs of market reversals or reinforcing trends as support levels are well-contained but subject to market dynamics.
Smart Data Insight
Master the Perfect Entry & Exit for this Stock
Don't leave your profits to chance. Historically, this stock follows specific seasonal patterns that institutional traders use to maximize returns.
- ✅ Identify the "Golden Buying Window"
- ✅ Avoid high-risk correction cycles
- ✅ Backtested data from the last 20+ years