September 28, 2025 a 03:15 pm
RVTY: Fibonacci Analysis - Revvity, Inc.
Revvity, Inc., operating in the diagnostics and life sciences sectors, has shown a significant price trend in recent months. As of late, the stock has been experiencing a broad downward trajectory reflecting challenges possibly correlated with broader market conditions or sector-specific pressures. This analysis delves into the recent price movements using Fibonacci retracement to identify potential support and resistance levels.
Fibonacci Analysis
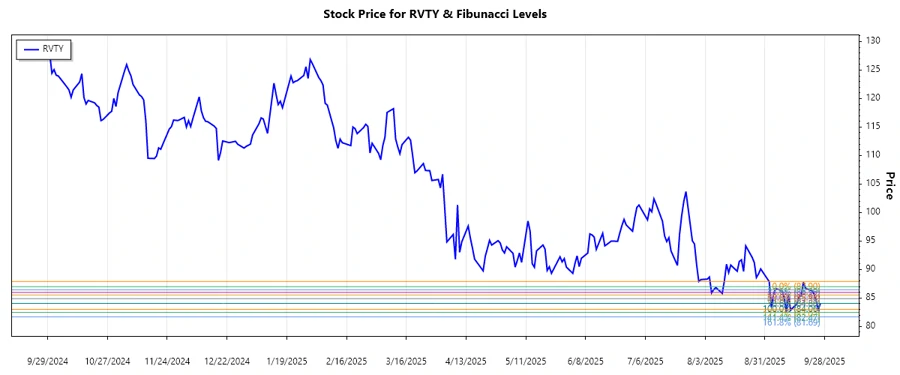
The recent data shows a clear downward trend in Revvity, Inc.'s stock price, starting from July 31, 2025, with a high of $87.90, descending to a low of $84.06 on September 26, 2025. Utilizing Fibonacci retracement levels, we'll identify key potential areas where the stock may find support or resistance.
| Details | Value |
|---|---|
| Start Date | 2025-07-31 |
| End Date | 2025-09-26 |
| High Price (Date) | $87.90 (2025-07-31) |
| Low Price (Date) | $84.06 (2025-09-26) |
Fibonacci Levels
| Level | Price |
|---|---|
| 0.236 | $85.45 |
| 0.382 | $86.09 |
| 0.5 | $86.65 |
| 0.618 | $87.21 |
| 0.786 | $87.92 |
The current price is in the 0.5 retracement zone, a potential area of resistance. Typically, this can mean that unless supported by additional bullish signals, the price could face challenges moving higher.
Conclusion
Revvity, Inc. is positioned in a volatile market, with recent price action showing a definitive downward trend as indicated by a retracement towards the 0.5 Fibonacci level. This level often acts as a pivot, and current pricing suggests caution due to potential resistance. Investors must weigh sector-specific risks and macroeconomic influences before engaging. Despite the technical challenges, the company's standing in the diagnostics and life sciences field provides a solid foundation for future growth. Close monitoring of price action and sector news is advised for making informed investment decisions.
Smart Data Insight
Master the Perfect Entry & Exit for this Stock
Don't leave your profits to chance. Historically, this stock follows specific seasonal patterns that institutional traders use to maximize returns.
- ✅ Identify the "Golden Buying Window"
- ✅ Avoid high-risk correction cycles
- ✅ Backtested data from the last 20+ years