September 27, 2025 a 11:45 am
RVTY: Fibonacci Analysis - Revvity, Inc.
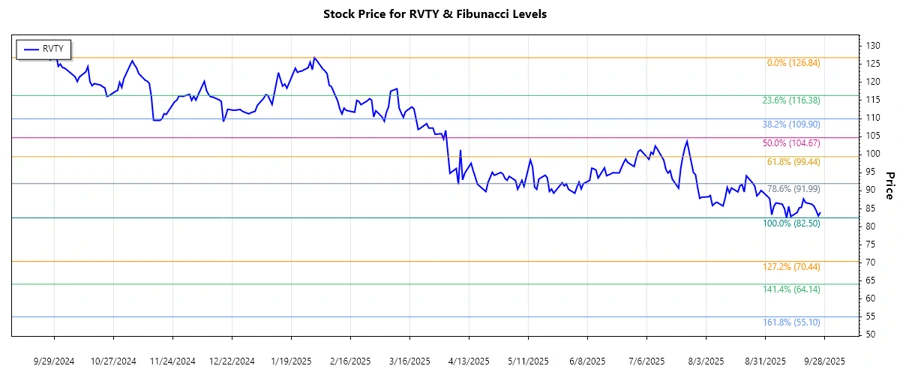
Revvity, Inc., formerly known as PerkinElmer, Inc., is a key player in the diagnostics, life sciences, and applied services markets. The company's stock has experienced significant fluctuations, characterized by both upward and downward movements. An in-depth technical analysis, including a Fibonacci retracement study, provides insights into potential support and resistance levels crucial for investors making informed decisions in the dynamic marketplace.
Fibonacci Analysis
| Detail | Information |
|---|---|
| Trend Type | Downtrend |
| Start Date | 2025-01-30 |
| End Date | 2025-09-26 |
| High Price & Date | $126.84 on 2025-01-30 |
| Low Price & Date | $82.5 on 2025-09-10 |
Fibonacci Retracement Levels
| Level | Price |
|---|---|
| 0.236 | $93.789 |
| 0.382 | $99.166 |
| 0.5 | $104.67 |
| 0.618 | $110.174 |
| 0.786 | $117.707 |
Currently, the RVTY stock price is situated around $84.06, indicating it is not within any Fibonacci retracement zones. The closest significant Fibonacci level is 0.236 at $93.789, suggesting potential resistance at that point.
The stock's behavior suggests potential support levels near $82.5, while the resistance might be examined around $93.789. Investors should look for additional confirmation of price movements before acting.
Conclusion
Revvity, Inc. has experienced a downward trend in recent months, reflected in its stock price fluctuations. The endangered support level adds a layer of risk, whereas potential Fibonacci retracement levels offer opportunities for technical trades. Stability near Fibonacci levels, especially 0.236, may hint at a developing support zone. Investors should remain vigilant, monitoring these levels closely for potential trend reversals or continued bearish movements.
Smart Data Insight
Master the Perfect Entry & Exit for this Stock
Don't leave your profits to chance. Historically, this stock follows specific seasonal patterns that institutional traders use to maximize returns.
- ✅ Identify the "Golden Buying Window"
- ✅ Avoid high-risk correction cycles
- ✅ Backtested data from the last 20+ years