July 16, 2025 a 05:15 am

RVTY: Fibonacci Analysis - Revvity, Inc.
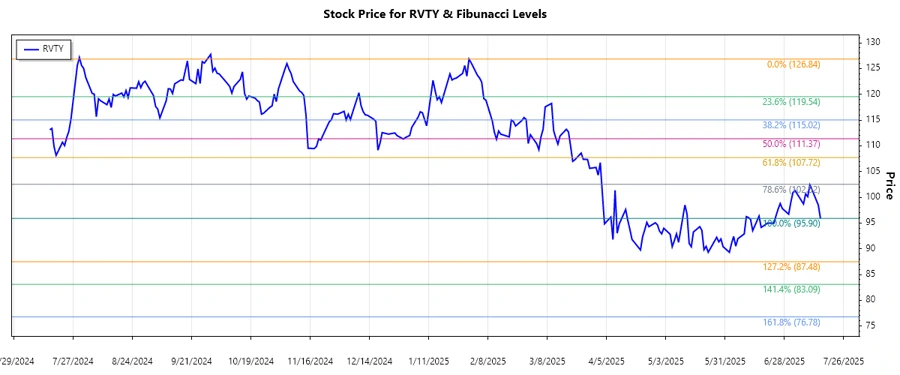
Revvity, Inc. operates across diverse scientific markets, offering essential solutions for diagnostics and life sciences. Recently, the stock's performance has been varied, with oscillations reflecting broader market sentiments and internal corporate developments. As a stalwart in its industry, Revvity is well-positioned for long-term growth despite its exposure to economic cyclicality and competitive pressures. This analysis takes a closer look at the recent price trend and key levels using the Fibonacci retracement method, which can provide clues about potential price reversals and continuations. Investors should stay informed about sector developments, which can significantly impact the stock's trajectory.
Fibonacci Analysis
The recent trend observed in Revvity, Inc.'s stock prices is a downward trend. Analyzing the historical price data, we identify the high point on 2024-10-01 at $126.84 and the low point on 2025-07-15 at $95.9. Using these as the basis, the following Fibonacci retracement levels have been calculated.
| Trend Start Date | Trend End Date | High Price Date | Low Price Date | High Price | Low Price |
|---|---|---|---|---|---|
| 2024-10-01 | 2025-07-15 | 2024-10-01 | 2025-07-15 | $126.84 | $95.9 |
| Fibonacci Level | Price Level |
|---|---|
| 23.6% | $103.30 |
| 38.2% | $108.05 |
| 50.0% | $111.37 |
| 61.8% | $114.68 |
| 78.6% | $119.36 |
Currently, the price is at $95.9, which is below all calculated retracement levels, indicating that the stock has not yet entered a significant retracement zone. This suggests possible continued weakness, but once a retracement level is reached, it might serve as a resistance, potentially halting further declines.
Conclusion
Revvity, Inc. finds itself amidst a prevailing downward trend, not uncommon for a company with broad market exposure. The recent price lows offer an affordable entry for potential reversals, although investors should remain cautious of further declines. The Fibonacci levels provide technical markers, serving as potential points of interest for support or resistance. Analysts could view the breach of any higher retracement levels as bullish signals, suggesting a recovering trend. Meanwhile, failure to do so could imply sustained bearish pressures. Watching sector trends and broader market indicators will be instrumental in anticipating future stock movement.
Smart Data Insight
Master the Perfect Entry & Exit for this Stock
Don't leave your profits to chance. Historically, this stock follows specific seasonal patterns that institutional traders use to maximize returns.
- ✅ Identify the "Golden Buying Window"
- ✅ Avoid high-risk correction cycles
- ✅ Backtested data from the last 20+ years