August 06, 2025 a 07:31 am


RVTY: Dividend Analysis - Revvity, Inc.
The analysis of Revvity, Inc. reveals a stable dividend position with a consistent payout over 43 years. Despite a low dividend yield, the company's commitment to maintaining its dividend is evident, with no cuts or suspensions since 1996. This indicates a potential for long-term income stability, aligning with investor expectations for reliable, albeit modest, returns.
📊 Overview
Revvity, Inc. positions itself firmly in its sector with a steady dividend history. Despite a modest dividend yield, consistency over four decades highlights its commitment to shareholders.
| Sector | Dividend yield | Current dividend per share (USD) | Dividend history (years) | Last cut or suspension |
|---|---|---|---|---|
| Unknown | 0.32% | 0.28 | 43 | 1996 |
📈 Dividend History
The dividend history of Revvity, Inc. demonstrates unwavering commitment to shareholder value through consistent payouts since the mid-90s. This long-standing history is a key indicator of the company’s financial health and management’s dedication.
| Year | Dividend Per Share (USD) |
|---|---|
| 2025 | 0.28 |
| 2024 | 0.28 |
| 2023 | 0.28 |
| 2022 | 0.28 |
| 2021 | 0.28 |
📉 Dividend Growth
Revvity, Inc. exhibits no dividend growth over both the 3- and 5-year periods. This stagnation can be viewed negatively in terms of growth, but it signifies the company's stability in its payouts.
| Time | Growth |
|---|---|
| 3 years | 0% |
| 5 years | 0% |
The average dividend growth is 0% over 5 years. This shows moderate but steady dividend growth.
🗣️ Payout Ratio
The payout ratios provide insight into Revvity, Inc.’s financial prudence. With an EPS-based payout ratio of approximately 11.57% and a FCF-based ratio of 6.50%, the company showcases a solid buffer for dividend payouts, suggesting reliability and secure financial operations.
| Key figure | Ratio |
|---|---|
| EPS-based | 11.57% |
| Free cash flow-based | 6.50% |
With a conservative payout approach, Revvity, Inc. ensures sufficient reinvestment into the business, balancing income with sustainability.
✅ Cashflow & Capital Efficiency
Analyzing cashflow metrics is crucial in assessing Revvity, Inc.'s financial robustness and capital efficiency. This data emphasizes efficient capital allocation and robust cashflow management.
| Metric | 2024 | 2023 | 2022 |
|---|---|---|---|
| Free Cash Flow Yield | 3.96% | 0.07% | 3.36% |
| Earnings Yield | 1.98% | 5.08% | 3.22% |
| CAPEX to Operating Cash Flow | 13.8% | 89.1% | 12.6% |
| Stock Compensation to Revenue | 1.37% | 1.51% | 1.56% |
| FCF / Operating Cash Flow Ratio | 86.2% | 10.8% | 87.4% |
The ratios reflect the company's ability to manage and allocate its capital efficiently, suggesting a well-managed treasury in turbulent financial conditions.
⚠️ Balance Sheet & Leverage Analysis
Evaluating leverage ratios illuminates Revvity, Inc.'s capital structure and debt management strategies, pivotal for understanding the firm’s risk profile.
| Metric | 2024 | 2023 | 2022 |
|---|---|---|---|
| Debt-to-Equity | 0.43 | 0.52 | 0.62 |
| Debt-to-Assets | 0.27 | 0.30 | 0.33 |
| Debt-to-Capital | 0.30 | 0.34 | 0.38 |
| Net Debt to EBITDA | 2.55 | 4.42 | 3.50 |
| Current Ratio | 3.33 | 2.07 | 2.13 |
| Quick Ratio | 3.03 | 1.77 | 1.87 |
| Financial Leverage | 1.62 | 1.72 | 1.91 |
The balance sheet analyses reinforce the company's commitment to maintaining a strong capital position, reducing debt over time, and safeguarding liquidity.
🗣️ Fundamental Strength & Profitability
Reviewing profitability ratios provides insight into Revvity, Inc.'s operational efficiency, highlighting areas of financial strength and potential growth.
| Metric | 2024 | 2023 | 2022 |
|---|---|---|---|
| Return on Equity | 3.53% | 8.80% | 7.71% |
| Return on Assets | 2.18% | 5.11% | 4.03% |
| Net Margin | 9.81% | 25.20% | 17.19% |
| EBIT Margin | 14.97% | 10.24% | 22.82% |
| EBITDA Margin | 30.50% | 25.94% | 35.71% |
| Gross Margin | 55.81% | 55.98% | 60.08% |
| R&D to Revenue | 7.14% | 7.87% | 6.69% |
The analysis underscores Revvity, Inc.'s operational strengths and robust profitability margins, painting a picture of a resilient and efficient business model.
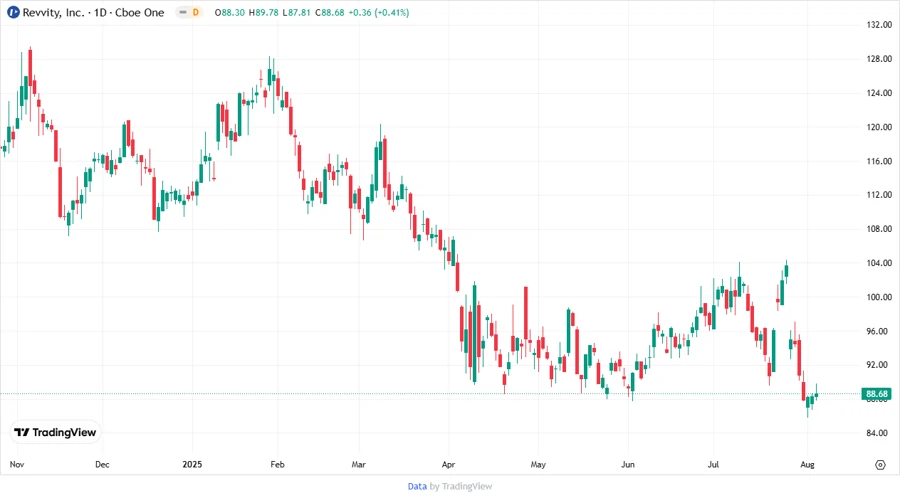
📉 Price Development
📊 Dividend Scoring System
| Category | Score (1-5) | Score Bar |
|---|---|---|
| Dividend yield | 2 | |
| Dividend Stability | 5 | |
| Dividend growth | 1 | |
| Payout ratio | 5 | |
| Financial stability | 4 | |
| Dividend continuity | 5 | |
| Cashflow Coverage | 4 | |
| Balance Sheet Quality | 3 |
Total Score: 29/40
Rating
Overall, Revvity, Inc. presents a dependable dividend investment with a strong history of stable payouts. While its yield and growth are modest, the company's financial health and management commitment make it a sound choice for income-focused portfolios. It's recommended for conservative investors seeking reliability over high but volatile returns.
Smart Data Insight
Master the Perfect Entry & Exit for this Stock
Don't leave your profits to chance. Historically, this stock follows specific seasonal patterns that institutional traders use to maximize returns.
- ✅ Identify the "Golden Buying Window"
- ✅ Avoid high-risk correction cycles
- ✅ Backtested data from the last 20+ years