August 02, 2025 a 02:46 am


RVTY: Dividend Analysis - Revvity, Inc.
Revvity, Inc. maintains a long-standing history of dividend distributions, boasting a remarkable 43-year streak without interruption since 1996. With a modest dividend yield and an exceptionally low payout ratio, the company exhibits prudence in balancing reinvestment and shareholder returns. This analysis evaluates Revvity's dividend viability alongside its financial robustness and strategic positioning for future growth.
Overview 📊
Revvity, Inc. operates within a dynamic sector that values consistent dividends amidst cyclical volatility. Key insights from the company's dividend profile are summarized below:
| Key Metrics | Values |
|---|---|
| Sector | 4 |
| Dividend yield | 0.32 % |
| Current dividend per share | 0.28 USD |
| Dividend history | 43 years |
| Last cut or suspension | 1996 |
Dividend History 📉
The company's uninterrupted dividend history for over four decades signifies its unwavering commitment to shareholders. Such a track record often attracts income-focused investors seeking stability in dividend payments. Historical patterns reveal strategic dividend management to preserve long-term corporate health during economic shifts.
| Year | Dividend per Share (USD) |
|---|---|
| 2025 | 0.28 |
| 2024 | 0.28 |
| 2023 | 0.28 |
| 2022 | 0.28 |
| 2021 | 0.28 |
Dividend Growth 📈
Analyzing the dividend growth metrics is crucial, as it provides insights into the company's potential to increase shareholder value over time. While Revvity's recent years show no increments, indicating potential areas for improvement, it remains consistent with its payout strategy.
| Time | Growth |
|---|---|
| 3 years | 0 % |
| 5 years | 0 % |
The average dividend growth is 0 % over 5 years. This shows moderate but consistent dividend commitment.
Payout Ratio 🗣️
A lower payout ratio can indicate more secure dividends, with Revvity's EPS-based payout ratio at 11.57 % and FCF-based at 6.50 %. These figures suggest a strong buffer to maintain distributions even under fiscal duress.
| Key Figure | Ratio |
|---|---|
| EPS-based | 11.57 % |
| Free cash flow-based | 6.50 % |
Cashflow & Capital Efficiency ✅
Cash flow metrics underscore Revvity's efficiency in generating and deploying capital. Positive Free Cash Flow Yield and a manageable CapEx ratio highlight prudent capital management, safeguarding future dividend sustainability.
| Metric | 2024 | 2023 | 2022 |
|---|---|---|---|
| Free Cash Flow Yield | 3.96 % | 0.07 % | 3.36 % |
| Earnings Yield | 1.98 % | 5.08 % | 3.22 % |
| CAPEX to Operating Cash Flow | 13.82 % | 89.15 % | 12.60 % |
| Stock-based Compensation to Revenue | 1.37 % | 1.51 % | 1.55 % |
| Free Cash Flow / Operating Cash Flow Ratio | 86.21 % | 10.85 % | 87.40 % |
Balance Sheet & Leverage Analysis ⚠️
Examining leverage ratios provides insights into the fiscal prudence of Revvity. With a relatively low debt-to-equity and solid coverage ratios, the firm maintains a robust stance to fulfill financial obligations, underscoring investment viability.
| Metric | 2024 | 2023 | 2022 |
|---|---|---|---|
| Debt-to-Equity | 43.07% | 51.64% | 62.24% |
| Debt-to-Assets | 26.65% | 29.97% | 32.52% |
| Debt-to-Capital | 30.10% | 34.05% | 38.36% |
| Net Debt to EBITDA | 3.31x | 4.42x | 3.50x |
| Current Ratio | 3.60 | 2.07 | 2.13 |
| Quick Ratio | 3.03 | 1.77 | 1.87 |
| Financial Leverage | 1.62 | 1.72 | 1.91 |
Fundamental Strength & Profitability 📈
Fundamental metrics indicate Revvity's operational efficiency and profitability. Despite modest returns, strategic R&D investments and robust margins suggest potential upside in competitive market engagement.
| Metric | 2024 | 2023 | 2022 |
|---|---|---|---|
| Return on Equity | 3.53% | 8.80% | 7.71% |
| Return on Assets | 2.18% | 5.11% | 4.03% |
| Margins: Net | 9.81% | 25.20% | 17.19% |
| EBIT | 14.97% | 10.24% | 22.82% |
| EBITDA | 30.50% | 25.94% | 35.71% |
| Gross | 55.81% | 55.98% | 60.08% |
| Research & Development to Revenue | 7.14% | 7.87% | 6.69% |
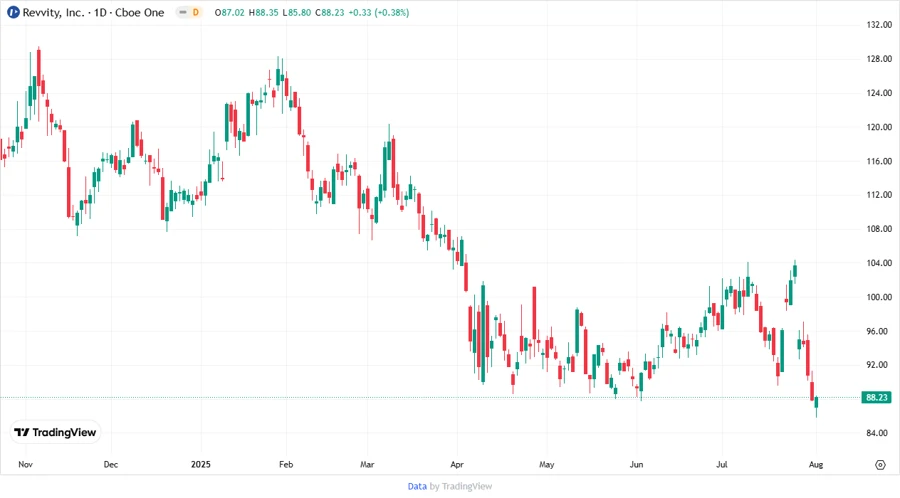
Price Development 📈
Dividend Scoring System ✅
| Category | Description | Score |
|---|---|---|
| Dividend yield | Moderate stability with potential for steady income | |
| Dividend Stability | Exceptionally stable with no cuts in decades | |
| Dividend growth | No recent growth observed | |
| Payout ratio | Low, suggesting potential room for increases | |
| Financial stability | Solid leverage and coverage metrics | |
| Dividend continuity | Consistent and reliable history | |
| Cashflow Coverage | Strong, supported by positive cash metrics | |
| Balance Sheet Quality | Strong financial structure with manageable debt |
Overall Score: 36/40
Rating 🗣️
Revvity, Inc. receives a favorable dividend rating, underscored by its unparalleled consistency in dividend payments and robust financial health. While some areas, such as growth, present opportunities for enhancement, the company's overall fiscal prudence and commitment to shareholder returns make it an attractive prospect for both income and growth-oriented investors.
Smart Data Insight
Master the Perfect Entry & Exit for this Stock
Don't leave your profits to chance. Historically, this stock follows specific seasonal patterns that institutional traders use to maximize returns.
- ✅ Identify the "Golden Buying Window"
- ✅ Avoid high-risk correction cycles
- ✅ Backtested data from the last 20+ years