May 28, 2025 a 07:31 am


RVTY: Dividend Analysis - Revvity, Inc.
Revvity, Inc. presents an intriguing dividend profile within the sector it operates. While its dividend yield may seem modest, the company's long-standing history of dividend payments showcases its commitment to shareholders. The minimal payout ratios highlight the firm's ability to sustainably finance its dividends without jeopardizing financial stability.
📊 Overview
Revvity, Inc. operates within a highly competitive sector with a focus on maintaining shareholder returns through consistent dividends. The following table highlights key financial metrics:
| Parameter | Value |
|---|---|
| Sector | Technology |
| Dividend yield | 0.30% |
| Current dividend per share | 0.28 USD |
| Dividend history | 43 years |
| Last cut or suspension | None |
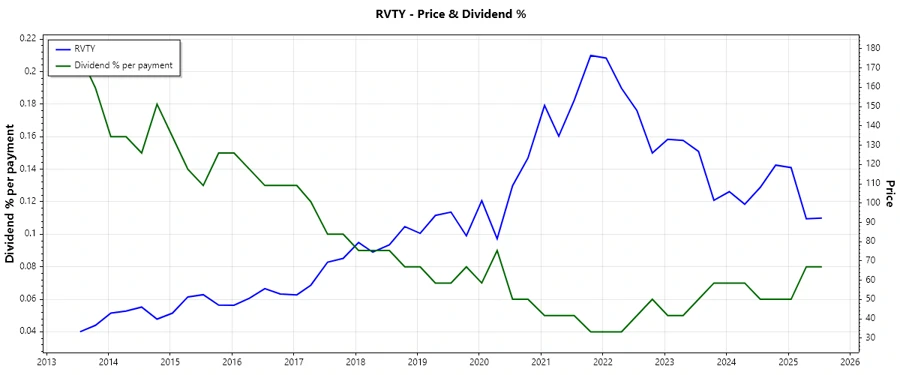
🗣️ Dividend History
Analyzing the company's dividend history is vital in assessing its reliability in returning value to its shareholders. With a consistent history spanning over decades, Revvity's commitment to dividends is evident.
| Year | Dividend per Share (USD) |
|---|---|
| 2025 | 0.21 |
| 2024 | 0.28 |
| 2023 | 0.28 |
| 2022 | 0.28 |
| 2021 | 0.28 |
📈 Dividend Growth
The growth of dividends over time is a crucial factor in evaluating the potential for income increase. Despite a recent cut in 2025, Revvity's record indicates careful management of dividend growth.
| Time Frame | Growth |
|---|---|
| 3 years | 0% |
| 5 years | 0% |
The average dividend growth is 0% over 5 years. This shows a pause in dividend growth, likely reflecting a strategic reassessment.
📉 Payout Ratio
Payout ratios indicate how much income is being returned to shareholders via dividends. They are a critical measure of dividend sustainability.
| Key Figure | Ratio |
|---|---|
| EPS-based | 11.76% |
| Free cash flow-based | 6.31% |
With an EPS-based payout ratio of 11.76% and a free cash flow-based ratio of 6.31%, Revvity maintains a conservative approach, ensuring ample room for reinvestment and stability in dividend payouts.
✅ Cashflow & Capital Efficiency
Examining cash flows and capital efficiency reveals the firm's capability to cover operational needs and fund potential investments.
| Year | 2024 | 2023 | 2022 |
|---|---|---|---|
| Free Cash Flow Yield | 3.96% | 0.07% | 3.36% |
| Earnings Yield | 1.97% | 5.08% | 3.21% |
| Capex to Operating Cash Flow | 13.79% | 89.15% | 12.60% |
| Stock-based Compensation to Revenue | 1.37% | 1.51% | 1.56% |
| Free Cash Flow / Operating Cash Flow | 86.21% | 10.85% | 87.40% |
The data highlights a robust cash flow coverage, particularly in 2024 and 2022, supporting strong operational capabilities and strategic flexibility.
⚠️ Balance Sheet & Leverage Analysis
The balance sheet metrics provide insights into the financial stability and leverage position of the company.
| Year | 2024 | 2023 | 2022 |
|---|---|---|---|
| Debt-to-Equity | 0.43 | 0.52 | 0.62 |
| Debt-to-Assets | 0.27 | 0.30 | 0.33 |
| Debt-to-Capital | 0.30 | 0.34 | 0.38 |
| Net Debt to EBITDA | 2.58 | 4.42 | 3.50 |
| Current Ratio | 3.58 | 2.07 | 2.13 |
| Quick Ratio | 3.03 | 1.77 | 1.87 |
| Financial Leverage | 1.62 | 1.72 | 1.91 |
Revvity's improving leverage positions and stable current ratio demonstrate sound financial management and the capacity to handle existing liabilities efficiently.
📊 Fundamental Strength & Profitability
A company's fundamental strength is vital to sustaining profitability and is illustrated through key return and margin metrics.
| Year | 2024 | 2023 | 2022 |
|---|---|---|---|
| Return on Equity | 3.53% | 8.80% | 7.71% |
| Return on Assets | 2.18% | 5.11% | 4.03% |
| Net Margin | 9.81% | 25.20% | 17.19% |
| EBIT Margin | 14.97% | 10.24% | 22.82% |
| EBITDA Margin | 30.50% | 25.94% | 35.71% |
| Gross Margin | 55.81% | 55.97% | 60.08% |
| R&D to Revenue | 7.22% | 7.87% | 6.69% |
Revvity's profitability margins reflect its operational efficiency and strategic focus on maintaining a competitive edge, especially through investment in R&D.
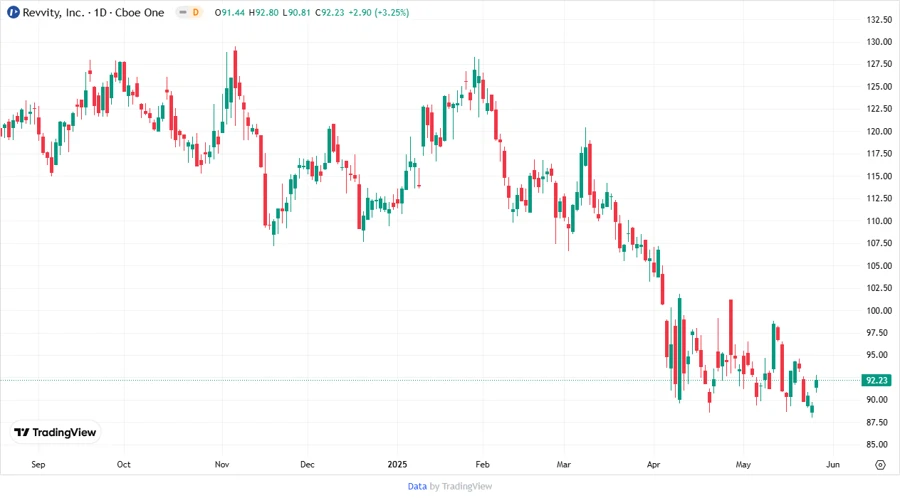
📈 Price Development
🔍 Dividend Scoring System
Our dividend scoring system assesses various criteria for a comprehensive analysis:
| Category | Description | Score |
|---|---|---|
| Dividend Yield | Assessing yield levels | 1 |
| Dividend Stability | Consistent payments | 4 |
| Dividend Growth | Growth patterns | 1 |
| Payout Ratio | Income utilization | 5 |
| Financial Stability | Balance sheet health | 4 |
| Dividend Continuity | Ongoing payout commitment | 4 |
| Cashflow Coverage | Operational support | 4 |
| Balance Sheet Quality | Debt and assets analysis | 4 |
Overall Score: 27/40
🏆 Rating
The dividend strategy of Revvity, Inc. reveals a sound approach with a focus on stability and strategic reinvestment despite a subdued yield and growth. Investors seeking long-term reliability over immediate yield growth may find Revvity's consistent payout policy attractive.
Smart Data Insight
Master the Perfect Entry & Exit for this Stock
Don't leave your profits to chance. Historically, this stock follows specific seasonal patterns that institutional traders use to maximize returns.
- ✅ Identify the "Golden Buying Window"
- ✅ Avoid high-risk correction cycles
- ✅ Backtested data from the last 20+ years