
September 14, 2025 a 09:03 am
RTX: Trend and Support & Resistance Analysis - RTX Corporation
RTX Corporation, a prominent player in the aerospace and defense sectors, has demonstrated significant resilience and adaptability in the rapidly evolving market landscape. With its diverse portfolio across Collins Aerospace, Pratt & Whitney, and Raytheon, it continues to offer robust systems and services both commercially and militarily. The company's recent rebranding in July 2023 signifies a strategic shift that could potentially lead to further growth opportunities. The current technical analysis provides critical insights into trends and significant price zones impacting RTX's stock valuation.
Trend Analysis
| Date | Close Price | Trend |
|---|---|---|
| 2025-09-12 | $155.85 | ▼ |
| 2025-09-11 | $157.65 | ▲ |
| 2025-09-10 | $155.00 | ▲ |
| 2025-09-09 | $151.75 | ▼ |
| 2025-09-08 | $154.22 | ▲ |
| 2025-09-05 | $157.52 | ▼ |
| 2025-09-04 | $158.68 | ▲ |
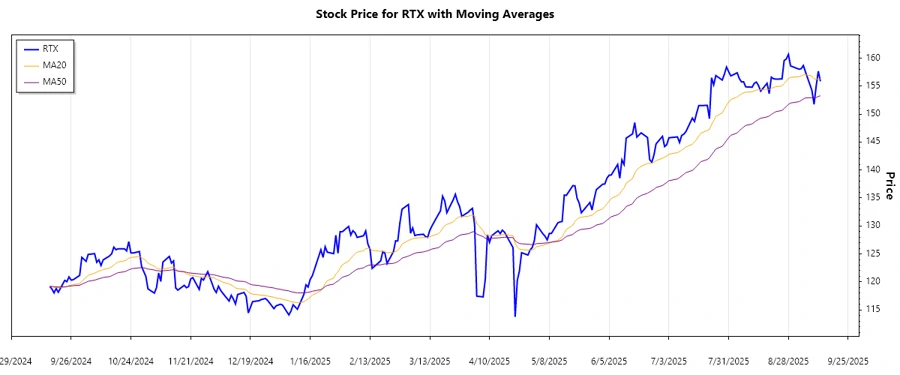
The analysis of the EMA20 and EMA50 indicates slight fluctuations around the EMA values, suggesting a possible emerging uptrend. The recent crossover and higher lows formation point towards potential upward momentum. However, volatility in the past week underscores the need for cautious optimism.
Support and Resistance
| Zone Type | Price Range | Position |
|---|---|---|
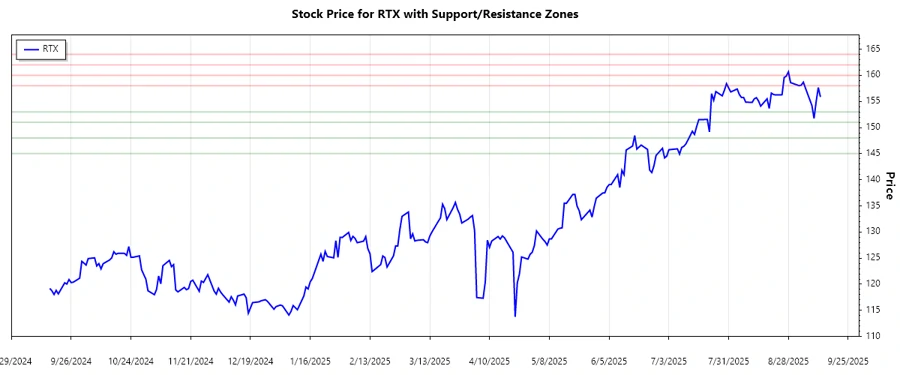
| Support | $145.00 - $148.00 | ▼ |
| Support | $151.00 - $153.00 | ▼ |
| Resistance | $158.00 - $160.00 | ▲ |
| Resistance | $162.00 - $164.00 | ▲ |
The stock is currently approaching the resistance zone $158.00 to $160.00, which might act as a price ceiling unless sustained buying pressure breaks through. Conversely, strong support at $151.00 to $153.00 provides a base, reducing downside risk.
Conclusion
In summary, RTX Corporation exhibits an overall positive trajectory, bolstered by its strategic market positioning and diversified service offerings. The approaching resistance levels may test the stock's upward momentum, while robust support areas underpin downside risks. Investors should stay vigilant for trend changes and breakout signals, as these could represent significant buying or selling opportunities. In the current market conditions, balancing growth potential against technical risks is crucial for stakeholders.
Smart Data Insight
Master the Perfect Entry & Exit for this Stock
Don't leave your profits to chance. Historically, this stock follows specific seasonal patterns that institutional traders use to maximize returns.
- ✅ Identify the "Golden Buying Window"
- ✅ Avoid high-risk correction cycles
- ✅ Backtested data from the last 20+ years