August 25, 2025 a 04:03 am

RTX: Trend and Support & Resistance Analysis - RTX Corporation
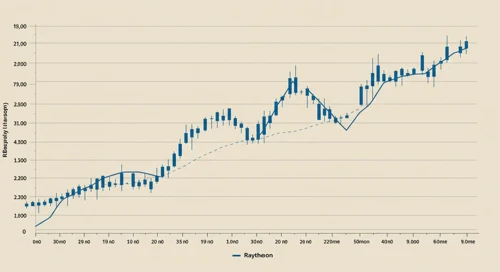
RTX Corporation, with its robust presence in the aerospace, defense, and commercial sectors, continues to demonstrate resilience. Recent data indicators suggest a predominantly sideways trend with occasional volatility. The recent name change from Raytheon Technologies marks a strategic shift and highlights its adaptability in a competitive landscape.
Trend Analysis
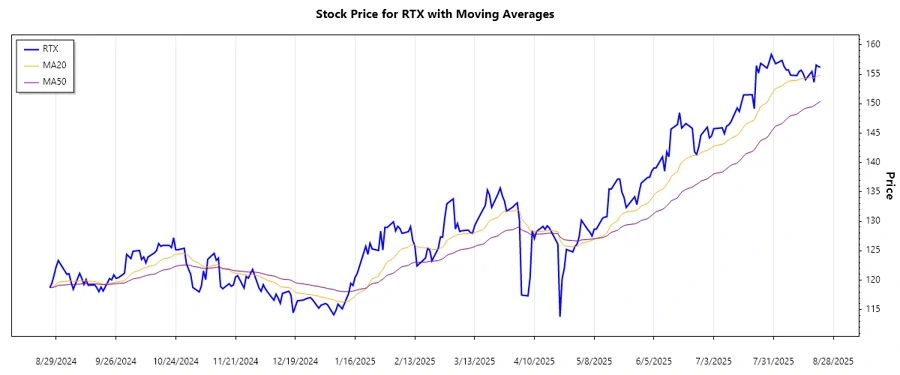
The recent analysis of RTX stock data reveals a noteworthy sideways trend with a marginal inclination towards an uptrend. By observing the calculated EMAs, EMA20 and EMA50, the EMA20 is slightly above EMA50, suggesting minor bullish signals.
| Date | Close Price | Trend |
|---|---|---|
| 2025-08-22 | 156.24 | ⚖️ |
| 2025-08-21 | 156.32 | ▲ |
| 2025-08-20 | 156.59 | ▲ |
| 2025-08-19 | 153.66 | ▼ |
| 2025-08-18 | 155.50 | ▲ |
| 2025-08-15 | 154.09 | ▼ |
| 2025-08-14 | 155.08 | ▲ |
Technical interpretation suggests agility in the current market conditions, keeping future prospects optimistic with monitored caution.
Support- and Resistance
The analysis identifies key support levels at $148.00 and $151.00, as well as resistance levels at $157.00 and $159.00. Current levels show the stock trading near the resistance zones.
| Zone Type | Price Range |
|---|---|
| Support Zone 1 | ⬇️ $148.00 - $151.00 |
| Support Zone 2 | ⬇️ $153.00 - $155.00 |
| Resistance Zone 1 | ⬆️ $157.00 - $159.00 |
| Resistance Zone 2 | ⬆️ $160.00 - $162.00 |
Currently hovering around key resistance, further bullish momentum will be pivotal to confirm an upward breakout.
Conclusion
RTX Corporation showcases a promising sideways trend with a mild bullish inclination, empowering its market standing amidst competitive sectors. Technical levels suggest pivotal zones with nearby resistance crucial for potential upside movement. Continued adaptability and strategic management strengthen its operating capabilities, yet monitoring geopolitical factors and market volatility remains essential. For analysts, staying aligned with these technical indicators can unlock lucrative opportunities, balancing risks with strategic insights.
Smart Data Insight
Master the Perfect Entry & Exit for this Stock
Don't leave your profits to chance. Historically, this stock follows specific seasonal patterns that institutional traders use to maximize returns.
- ✅ Identify the "Golden Buying Window"
- ✅ Avoid high-risk correction cycles
- ✅ Backtested data from the last 20+ years