March 14, 2026 a 04:44 pm
RTX: Fibonacci Analysis - RTX Corporation
RTX Corporation, with its broad aerospace and defense segments, exhibits dynamic potential for growth driven by its diverse portfolio and international reach. Recent trends indicate significant volatility, reflecting both geopolitical influences and internal strategic shifts. Investors are keenly observing the stock for its resilience and long-term performance potential, especially considering its recent rebranding from Raytheon Technologies. The company's ability to innovate and adapt in the defense and aerospace sector continues to be closely monitored by market analysts globally. A detailed technical analysis could provide further insights into potential investment opportunities.
Fibonacci Analysis
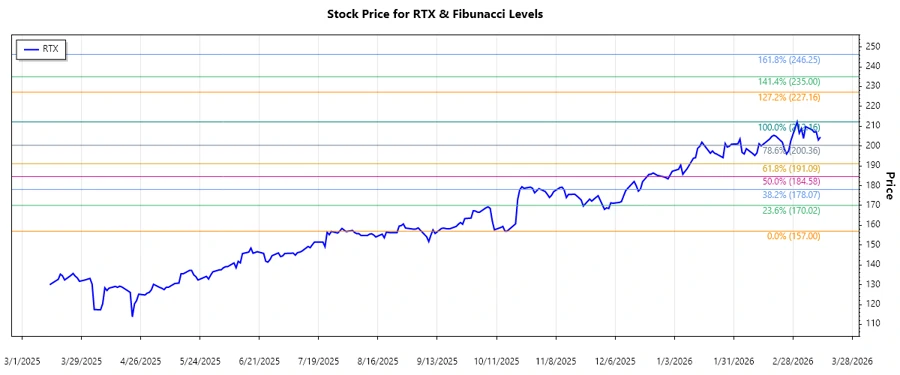
In our recent analysis of RTX Corporation, we noted a distinct upward trend between late 2025 to early 2026. The stock demonstrated a marked increase followed by volatile fluctuations. This pattern provides the foundation for a detailed Fibonacci Retracement analysis. Analyzing the data helps in identifying potential support and resistance levels.
| Start Date | End Date | High Point (Price/Date) | Low Point (Price/Date) | 0.236 Level | 0.382 Level | 0.5 Level | 0.618 Level | 0.786 Level | Current Retracement Zone | Technical Interpretation |
|---|---|---|---|---|---|---|---|---|---|---|
| 2025-10-13 | 2026-03-11 | 212.16 (2026-03-02) | 157.00 (2025-10-15) | 173.66 | 181.87 | 184.58 | 192.30 | 197.13 | 0.786 | The price is currently bouncing around the 0.786 retracement level, indicating a potential strong support before a possible continuation of the uptrend. |
Conclusion
The advances observed in RTX Corporation's stock indicate a promising upward trajectory, with Fibonacci levels suggesting potential support at critical junctures. Presently trading near the 0.786 level, there's significant interest in how the price holds against these support levels. Favorable outcomes could fuel further investor optimism, driven by the company's strategic initiatives in aerospace and defense. However, external factors, including global tensions and regulatory changes, impose risks. Investors might weigh these influences against the company’s robust performance prospects underlined by technical indicators.