March 09, 2026 a 05:15 am
RTX: Fibonacci Analysis - RTX Corporation
RTX Corporation has shown resilience in the aerospace and defense industry, especially as the market continues to adapt to global challenges. The company's diverse segments, including Collins Aerospace, Pratt & Whitney, and Raytheon, provide robust growth opportunities. RTX is currently experiencing a dominant uptrend, showing investor confidence. However, investors should watch for any potential market shifts or geopolitical influences that might impact the defense sector.
Fibonacci Analysis
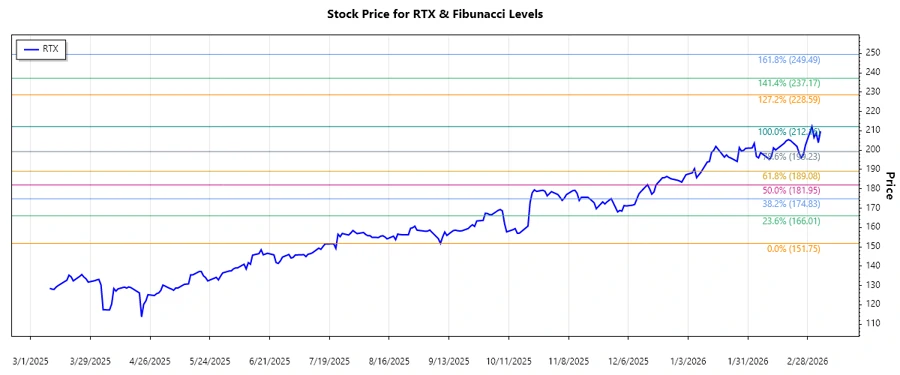
The recent trend for RTX Corporation's stock has been a significant uptrend, indicating a positive outlook from investors. The Fibonacci levels have been calculated based on the identified trend, marking potential support and resistance zones.
| Trend Start Date | Trend End Date | High Price & Date | Low Price & Date | Fibonacci Levels |
|---|---|---|---|---|
| 2025-09-09 | 2026-03-06 | $212.16 (2026-03-02) | $151.75 (2025-09-09) |
|
Currently, the stock price is near the 0.236 retracement level, indicating a potential strong support zone. If the price holds above this level, it may suggest continued bullish momentum.
From a technical perspective, these levels could act as potential support or resistance zones. Investors should monitor these levels closely as they could signify potential buying or selling opportunities based on price action behavior.
Conclusion
In summary, RTX Corporation is experiencing a strong uptrend, showing continued growth potential driven by its diverse operations across aerospace and defense. However, the industry's dependency on government contracts and international relations poses risks. The Fibonacci retracement levels serve as crucial indicators for potential support and resistance, providing insights into price action areas. Given the current price near the 0.236 retracement level, the stock appears to have strong support, suggesting potential bullish continuation.