October 28, 2025 a 04:44 pm
RTX: Fibonacci Analysis - RTX Corporation
The RTX Corporation, with its comprehensive portfolio in aerospace and defense, has shown a strong upward trend in recent months. This trend is characterized by technological innovation and robust performance across its key segments. While the stock has shown resilience, the potential for market fluctuations based on geopolitical tensions should be monitored closely by investors.
Fibonacci Analysis
| Detail | Information |
|---|---|
| Start Date | 2024-10-28 |
| End Date | 2025-10-28 |
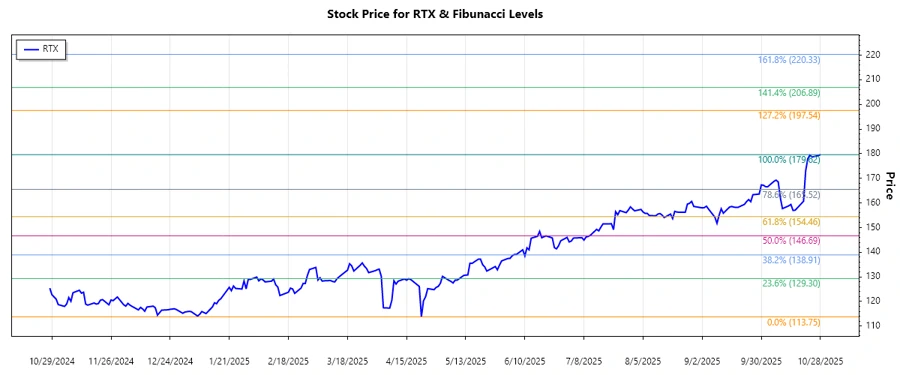
| High Price and Date | $179.62 on 2025-10-28 |
| Low Price and Date | $113.75 on 2025-04-22 |
| Fibonacci Levels |
|
| Current Price | $179.62 |
| Retracement Zone | None - Above 0.786 |
| Interpretation | The stock is currently above all major Fibonacci retracement levels, suggesting continued momentum without significant reversal signals. This positions the stock to potentially face psychological resistance around all-time highs. |
Conclusion
RTX Corporation's expansive capabilities in aerospace and defense provide a solid foundation for continued growth. The stock, currently in an upward trajectory, might encounter future resistance, but its current position suggests strength. Nonetheless, investors should remain vigilant of potential geopolitical disruptions. For analysts, this technical strength highlights the importance of data-driven decision-making.
Smart Data Insight
Master the Perfect Entry & Exit for this Stock
Don't leave your profits to chance. Historically, this stock follows specific seasonal patterns that institutional traders use to maximize returns.
- ✅ Identify the "Golden Buying Window"
- ✅ Avoid high-risk correction cycles
- ✅ Backtested data from the last 20+ years