
June 06, 2026 a 07:31 am

RTX: Dividend Analysis - RTX Corporation
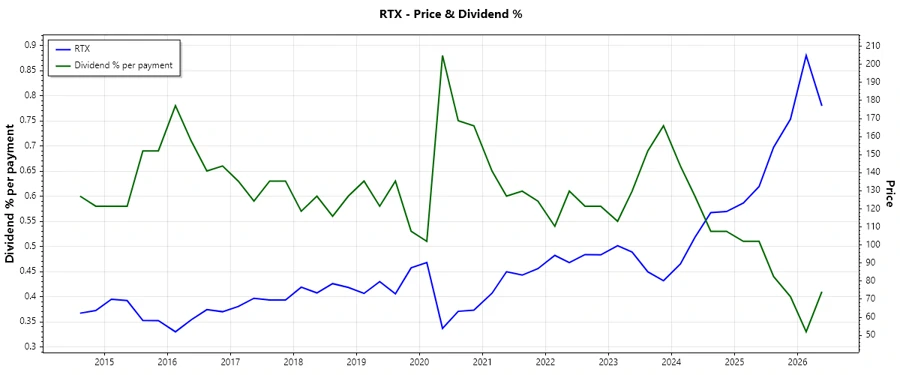
RTX Corporation has been a steadfast performer in the market with a significant legacy of dividend payments spanning 57 years. The consistency in their dividend payouts, coupled with prudent management of payout ratios, makes them a plausible candidate for income-focused investors. However, with a moderate dividend yield of 1.56%, an evaluation of overall market conditions and the corporation's growth potential is paramount to ensure sustainable returns.
📊 Overview
The overview of RTX Corporation indicates a robust structural foundation within the industry. Their prolonged dividend history underscores their commitment to shareholders.
| Metrics | Value |
|---|---|
| Sector | Industrial |
| Dividend Yield | 1.56% |
| Current Dividend Per Share | 2.66 USD |
| Dividend History | 57 years |
| Last Cut or Suspension | None |
📈 Dividend History
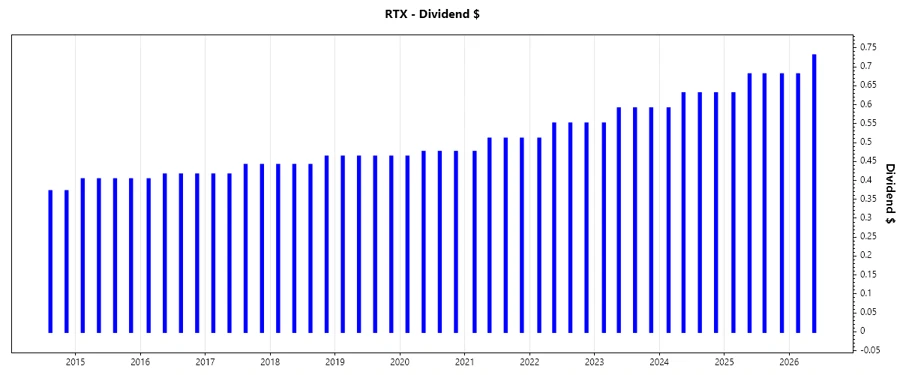
The extensive dividend history of RTX Corporation highlights the reliability and stability of its dividend policy. The ability to sustain and incrementally grow its dividend over decades lends confidence to both current and prospective shareholders. Such consistency indicates robust financial health and well-thought-out corporate strategies.
| Year | Dividend Per Share (USD) |
|---|---|
| 2026 | 1.41 |
| 2025 | 2.67 |
| 2024 | 2.48 |
| 2023 | 2.32 |
| 2022 | 2.16 |
📈 Dividend Growth
Identifying trends in dividend growth is essential for assessing potential future income from an investment. RTX Corporation exhibits a moderate but consistent dividend growth over the past few years, demonstrating a long-term strategy of shareholder value enhancement.
| Time | Growth |
|---|---|
| 3 years | 7.32% |
| 5 years | 7.18% |
The average dividend growth is 7.18% over 5 years. This shows moderate but steady dividend growth, indicative of RTX's stable financial strategies and prudent management.
⚠️ Payout Ratio
The payout ratio offers insight into a company's earnings distribution strategy. With an EPS-based payout ratio of 49.50% and an FCF-based payout ratio of 42.92%, RTX maintains a healthy balance between reinvestment and shareholder returns, ensuring sustainable growth and income.
| Key Figure | Ratio |
|---|---|
| EPS-based | 49.50% |
| Free Cash Flow-based | 42.92% |
The payout ratios are optimally managed to provide significant dividends while allowing for reinvestment in growth, reflecting RTX's strategic financial management.
📈 Cashflow & Capital Efficiency
Cash flow and capital efficiency metrics are pivotal for assessing a firm's liquidity and operational performance. They are indicators of the company's ability to sustain operations and finance dividends out of generated cash flows.
| Year | 2025 | 2024 | 2023 |
|---|---|---|---|
| Free Cash Flow Yield | 3.23% | 2.94% | 3.93% |
| Earnings Yield | 2.74% | 3.10% | 2.66% |
| CAPEX to Operating Cash Flow | 24.86% | 36.67% | 40.16% |
| Stock-based Compensation to Revenue | 1.23% | 0.54% | 0.62% |
| Free Cash Flow / Operating Cash Flow Ratio | 75.14% | 63.33% | 59.84% |
RTX shows a commendable cash flow stability with efficient capital allocation, crucial for ensuring continuous dividend payments and fostering growth.
📊 Balance Sheet & Leverage Analysis
Analyzing the balance sheet metrics including debt ratios provides insights on a firm's leverage and financial health. It helps infer the sustainability of operations and capacity to service debt.
| Year | 2025 | 2024 | 2023 |
|---|---|---|---|
| Debt-to-Equity | 0.61 | 0.71 | 0.76 |
| Debt-to-Assets | 0.23 | 0.26 | 0.28 |
| Debt-to-Capital | 0.38 | 0.42 | 0.43 |
| Net Debt to EBITDA | 2.15 | 2.98 | 3.98 |
| Current Ratio | 1.02 | 0.99 | 1.03 |
| Quick Ratio | 0.80 | 0.75 | 0.78 |
| Financial Leverage | 2.62 | 2.71 | 2.71 |
The stability indicated by debt and liquidity ratios shows RTX's solid financial policy, providing confidence in its debt repayment capabilities and maintaining operational efficiency.
📈 Fundamental Strength & Profitability
These metrics demonstrate the company's ability to generate profit relative to sales, assets, and equity, illustrating the overall health and potential for future growth.
| Year | 2025 | 2024 | 2023 |
|---|---|---|---|
| Return on Equity | 10.32% | 7.94% | 5.34% |
| Return on Assets | 3.94% | 2.93% | 1.97% |
| Margins: Net | 7.60% | 5.91% | 4.64% |
| EBIT Margin | 11.93% | 10.11% | 7.96% |
| EBITDA Margin | 16.87% | 15.52% | 14.07% |
| Gross Margin | 20.08% | 19.09% | 17.54% |
| R&D to Revenue | 3.16% | 3.63% | 4.07% |
Strong profitability alongside consistent returns on equity and assets underpins the company's stable operating performance and efficient resource utilization.
📉 Price Development
✅ Dividend Scoring System
| Criteria | Score | Score Bar |
|---|---|---|
| Dividend Yield | 3 | |
| Dividend Stability | 4 | |
| Dividend Growth | 4 | |
| Payout Ratio | 4 | |
| Financial Stability | 3 | |
| Dividend Continuity | 5 | |
| Cashflow Coverage | 4 | |
| Balance Sheet Quality | 4 |
Overall Score: 31/40
🗣️ Rating & Recommendation
RTX Corporation stands as a reliable option for dividend investors, with its commendable history of dividend payments and growth. The company exudes stability with well-managed payout ratios and sufficient cash flow coverage, ensuring consistent shareholder returns. Investors should consider RTX in portfolios that focus on long-term income with moderate growth expectations.
Smart Data Insight
Master the Perfect Entry & Exit for this Stock
Don't leave your profits to chance. Historically, this stock follows specific seasonal patterns that institutional traders use to maximize returns.
- ✅ Identify the "Golden Buying Window"
- ✅ Avoid high-risk correction cycles
- ✅ Backtested data from the last 20+ years