February 18, 2026 a 11:31 am
RTX: Dividend Analysis - RTX Corporation
RTX Corporation has established itself as a reliable dividend-paying company, showcasing a robust 57-year history without notable suspensions or cuts. The company's prudent financial management is reflected in its reasonable payout ratios, ensuring sustainable dividend growth. Investing in RTX brings a blend of stability and moderate growth, making it an attractive option for income-seeking investors.
📊 Overview
RTX Corporation, operating in the technology sector, demonstrates a solid commitment to dividend distribution. The current dividend yield stands at 1.34%, with a dividend of $2.66 per share, and a commendable history spanning 57 years without suspensions or cuts. This underscores the firm's financial resilience and dedication to shareholder returns.
| Metric | Value |
|---|---|
| Sector | Technology |
| Dividend Yield | 1.34 % |
| Current Dividend Per Share | 2.66 USD |
| Dividend History | 57 years |
| Last Cut or Suspension | None |
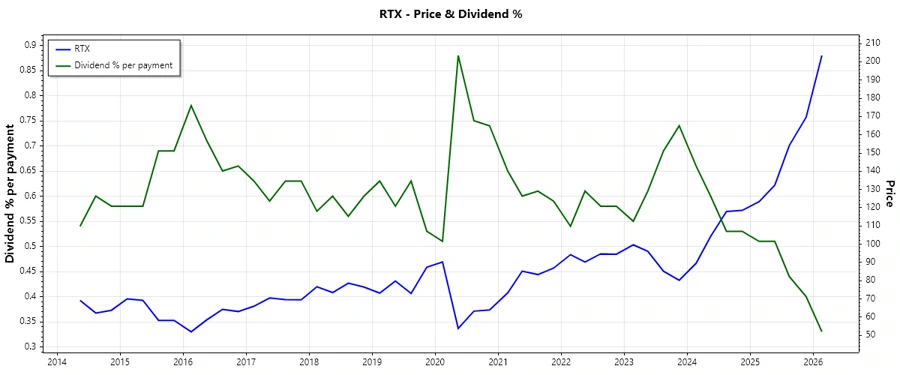
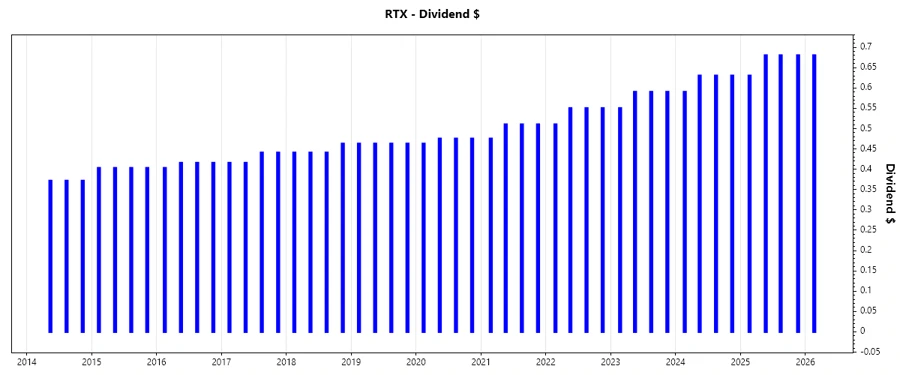
📈 Dividend History
RTX Corporation's dividend history is a testament to its financial discipline and strategic foresight. Over the years, it has maintained a consistent payout trajectory, ensuring dependable income for shareholders.
| Year | Dividend Per Share (USD) |
|---|---|
| 2026 | 0.68 |
| 2025 | 2.67 |
| 2024 | 2.48 |
| 2023 | 2.32 |
| 2022 | 2.16 |
✅ Dividend Growth
Dividend growth is vital for investors seeking income that outpaces inflation. RTX has shown stable growth, with its three-year growth rate at 7.32% and five-year rate at 7.18%, indicating potential for progressive income enhancement.
| Time | Growth |
|---|---|
| 3 years | 7.32 % |
| 5 years | 7.18 % |
The average dividend growth is 7.18% over 5 years. This shows moderate but steady dividend growth.
📉 Payout Ratio
The payout ratio indicates the proportion of earnings a company distributes in dividends, a critical measure of dividend sustainability. RTX's EPS-based payout ratio is 53.09%, while the FCF-based ratio is 44.93%. These figures demonstrate a well-balanced approach, ensuring dividends without compromising future growth.
| Key Figure | Ratio |
|---|---|
| EPS-based | 53.09 % |
| Free cash flow-based | 44.93 % |
With a 53.09% EPS payout ratio and 44.93% cash flow-based ratio, RTX maintains a prudent balance, conserving earnings for reinvestment and growth.
💰 Cashflow & Capital Efficiency
Cashflow analysis reveals the company's operational health and capital allocation efficacy. RTX's free cash flow yield, earnings yield, and capital efficiency metrics suggest positive cash flow generation and prudent capital investments, crucial for sustaining dividends and growth initiatives.
| Year | 2025 | 2024 | 2023 |
|---|---|---|---|
| Free Cash Flow Yield | 3.22 % | 2.94 % | 3.93 % |
| Earnings Yield | 2.73 % | 3.10 % | 2.66 % |
| CAPEX to Operating Cash Flow | 24.86 % | 36.67 % | 40.16 % |
| Stock-based Compensation to Revenue | 0.59 % | 0.54 % | 0.62 % |
| Free Cash Flow / Operating Cash Flow Ratio | 75.14 % | 63.33 % | 59.84 % |
RTX demonstrates robust cashflow stability and efficient capital allocation, supporting its dividend policy and long-term investment strategy.
🔍 Balance Sheet & Leverage Analysis
The balance sheet provides insights into financial stability and leverage. RTX maintains a moderate debt profile with manageable leverage, crucial for sustaining operational and financial flexibility amidst varying economic conditions.
| Year | 2025 | 2024 | 2023 |
|---|---|---|---|
| Debt-to-Equity | 60.55 % | 71.30 % | 75.65 % |
| Debt-to-Assets | 23.09 % | 26.34 % | 27.95 % |
| Debt-to-Capital | 37.71 % | 41.62 % | 43.07 % |
| Net Debt to EBITDA | 2.33 | 3.07 | 4.12 |
| Current Ratio | 1.03 | 0.99 | 1.04 |
| Quick Ratio | 0.80 | 0.74 | 0.78 |
| Financial Leverage | 2.62 | 2.71 | 2.71 |
RTX's financial structure reflects prudent leverage management, maintaining liquidity to address obligations and invest in opportunities.
📋 Fundamental Strength & Profitability
Fundamental strength and profitability metrics gauge operational efficiency and financial performance. RTX's robust returns and stable margins underscore its ability to generate consistent profits and preserve shareholder value.
| Year | 2025 | 2024 | 2023 |
|---|---|---|---|
| Return on Equity | 10.32 % | 7.94 % | 5.34 % |
| Return on Assets | 3.94 % | 2.93 % | 1.97 % |
| Margins: Net | 7.60 % | 5.91 % | 4.64 % |
| EBIT | 11.92 % | 10.11 % | 7.96 % |
| EBITDA | 15.56 % | 15.07 % | 13.60 % |
| Gross | 20.08 % | 19.09 % | 17.54 % |
| Research & Development to Revenue | 3.17 % | 3.63 % | 4.07 % |
RTX excels in profitability measures, with strong returns and diversified margins enhancing its competitive edge and financial fortitude.
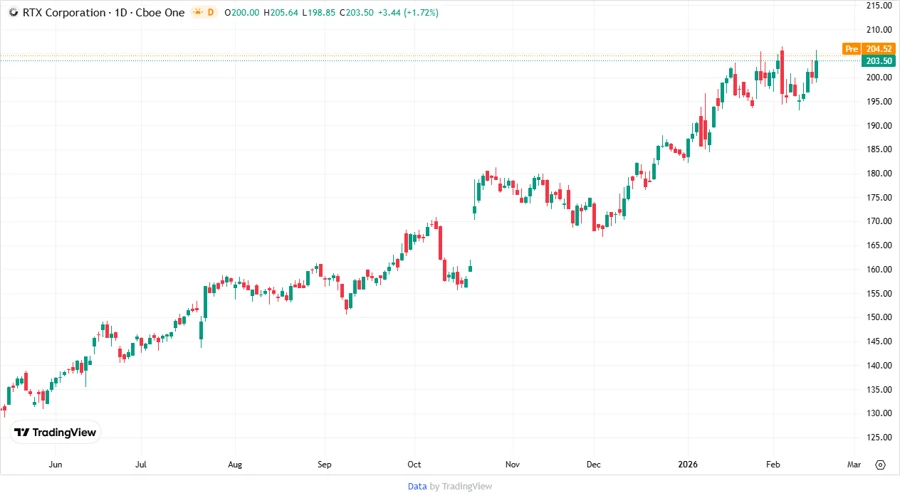
📊 Price Development
🗣️ Dividend Scoring System
| Criterion | Score | Score Bar |
|---|---|---|
| Dividend Yield | 4 | |
| Dividend Stability | 5 | |
| Dividend Growth | 4 | |
| Payout Ratio | 4 | |
| Financial Stability | 4 | |
| Dividend Continuity | 5 | |
| Cashflow Coverage | 4 | |
| Balance Sheet Quality | 4 |
Overall Score: 34/40
🗣️ Rating
RTX Corporation demonstrates a strong commitment to dividends with steady growth, balanced payout ratios, and a resilient financial structure. The overall dividend score of 34 out of 40 highlights its reliability and robust performance in delivering shareholder value. RTX is well-suited for investors seeking stability and moderate growth in dividend income.