November 16, 2025 a 02:46 am

📊 RTX: Dividend Analysis - RTX Corporation
RTX Corporation exhibits a robust dividend profile with a steady history of payouts over 56 years, reflecting stability and a commitment to returning value to shareholders. However, the relatively low dividend yield of 1.52% may limit its appeal to income-focused investors. The company's ability to grow dividends consistently over time is a positive indicator for long-term sustainability.
🗣️ Overview
The overview of RTX Corporation's dividend portfolio suggests a reliable and long-standing history of distributions. The sectoral alignment plays a key role in stabilizing dividend growth over the years.
| Key Metric | Value |
|---|---|
| Sector | Industrials |
| Dividend Yield | 1.52% |
| Current Dividend Per Share | 2.41 USD |
| Dividend History | 56 years |
| Last Cut/Suspension | 1992 |
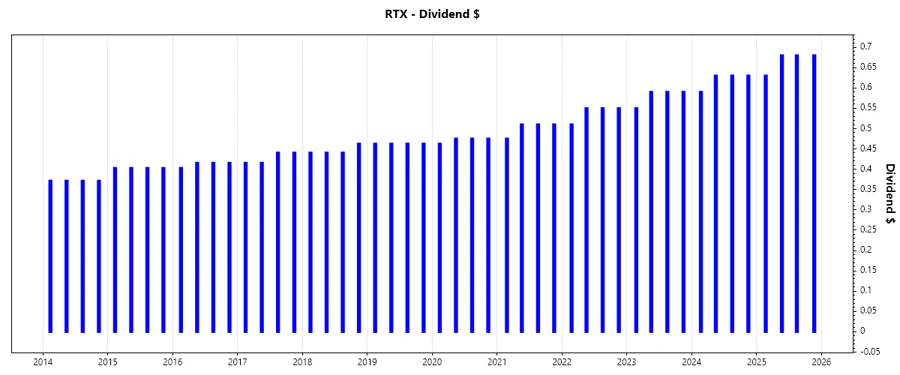
📈 Dividend History
The extensive dividend history of RTX demonstrates sustained delivery on shareholder returns, marking them as a pillar of reliability. This track record is crucial for investor confidence and future expectations.
| Year | Dividend Per Share (USD) |
|---|---|
| 2025 | 2.67 |
| 2024 | 2.48 |
| 2023 | 2.32 |
| 2022 | 2.16 |
| 2021 | 2.00 |
📉 Dividend Growth
Dividend growth is pivotal in gauging a company's capability to enhance investor returns over time. RTX's modest growth rates hint at gradual but reliable dividend improvements.
| Time | Growth |
|---|---|
| 3 years | 7.34% |
| 5 years | 6.03% |
The average dividend growth is 6.03% over 5 years. This shows moderate but steady dividend growth.
✅ Payout Ratio
Understanding payout ratios is crucial as it reflects the company's ability to sustain dividend payments from earnings and cash flow.
| Key Figure | Ratio |
|---|---|
| EPS-based | 49.10% |
| Free Cash Flow-based | 61.73% |
The EPS-based payout ratio of 49.10% and the FCF-based ratio of 61.73% indicate a balanced distribution strategy, allowing room for both reinvestment and consistent returns to shareholders.
💵 Cashflow & Capital Efficiency
Free Cash Flow and capital efficiency metrics provide insights into RTX's operational strength and investment capabilities, essential for dividend sustainability.
| Year | 2024 | 2023 | 2022 |
|---|---|---|---|
| Free Cash Flow Yield | 2.94% | 3.93% | 2.95% |
| Earnings Yield | 3.10% | 2.66% | 3.49% |
| CAPEX to Operating Cash Flow | 34.23% | 40.16% | 38.71% |
| Stock-based Compensation to Revenue | 0.54% | 0.62% | 0.63% |
| Free Cash Flow / Operating Cash Flow Ratio | 63.33% | 59.84% | 61.29% |
The analysis indicates stable cash flow generation and prudent capital allocation, underpinning the firm's dividend-paying capacity.
📉 Balance Sheet & Leverage Analysis
RTX's balance sheet and leverage metrics are crucial for evaluating financial health and the ability to sustain debt and dividends.
| Year | 2024 | 2023 | 2022 |
|---|---|---|---|
| Debt-to-Equity | 0.71 | 0.76 | 0.46 |
| Debt-to-Assets | 0.26 | 0.28 | 0.21 |
| Debt-to-Capital | 0.42 | 0.43 | 0.32 |
| Net Debt to EBITDA | 3.07 | 4.12 | 2.44 |
| Current Ratio | 1.07 | 1.04 | 1.09 |
| Quick Ratio | 0.74 | 0.78 | 0.81 |
| Financial Leverage | 2.71 | 2.71 | 2.19 |
Despite high leverage, RTX's operational metrics reflect adequate financial flexibility and stability.
🛡️ Fundamental Strength & Profitability
A comprehensive look at core profitability metrics informs RTX's potential to maintain shareholder value and financial health.
| Year | 2024 | 2023 | 2022 |
|---|---|---|---|
| Return on Equity | 7.94% | 5.34% | 7.15% |
| Return on Assets | 2.93% | 1.97% | 3.27% |
| Margins: Net | 5.91% | 4.64% | 7.75% |
| EBIT | 10.11% | 7.96% | 11.06% |
| EBITDA | 15.07% | 13.60% | 16.66% |
| Gross | 19.09% | 17.54% | 20.38% |
| R&D to Revenue | 3.63% | 4.07% | 4.04% |
RTX's profitability parameters reflect a mixed trend but highlight resilience in operational efficiency and innovation-led growth.
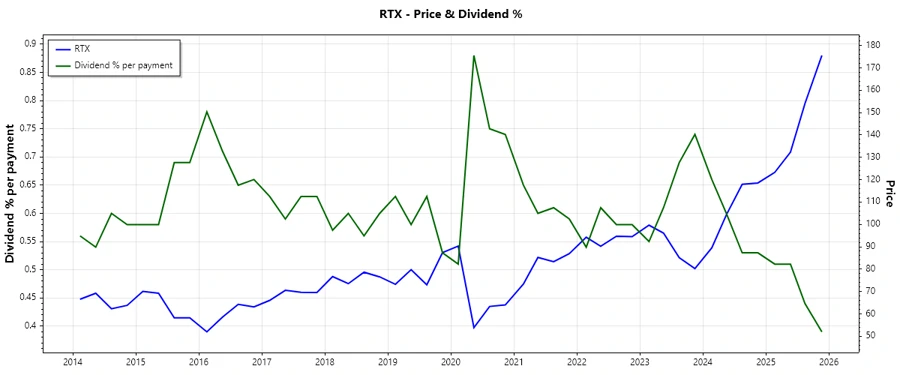
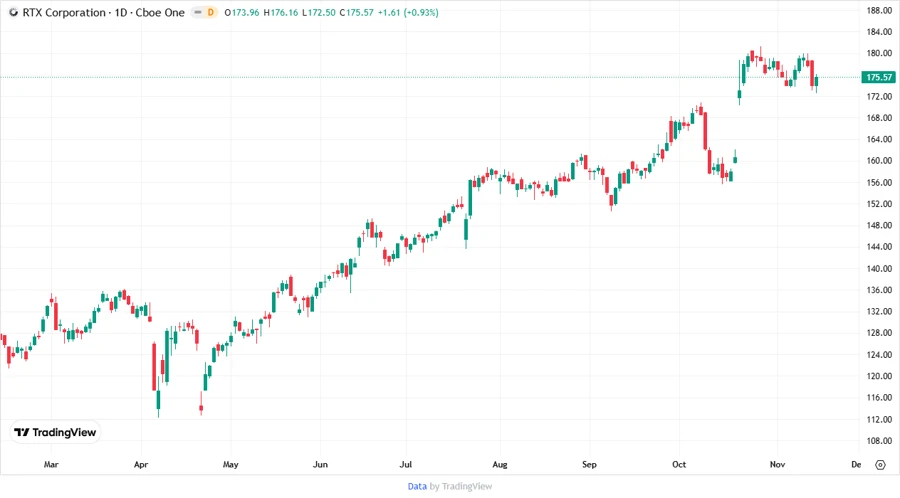
📈 Price Development
📊 Dividend Scoring System
| Criteria | Score | Score Bar |
|---|---|---|
| Dividend Yield | 3 | |
| Dividend Stability | 5 | |
| Dividend Growth | 4 | |
| Payout Ratio | 4 | |
| Financial Stability | 3 | |
| Dividend Continuity | 5 | |
| Cashflow Coverage | 4 | |
| Balance Sheet Quality | 3 |
Overall Score: 31/40
✨ Rating
RTX Corporation maintains a solid foundation for dividend growth with its extensive history and stable financial metrics. While the current yield might not be the highest, consistent increases and robust financial health make it a reliable choice for long-term dividend investors.
Smart Data Insight
Master the Perfect Entry & Exit for this Stock
Don't leave your profits to chance. Historically, this stock follows specific seasonal patterns that institutional traders use to maximize returns.
- ✅ Identify the "Golden Buying Window"
- ✅ Avoid high-risk correction cycles
- ✅ Backtested data from the last 20+ years