October 29, 2025 a 03:32 am

RTX: Dividend Analysis - RTX Corporation
As an industry leader with a substantial market cap, RTX Corporation stands out due to its impressive dividend history and consistent payout. With over 56 years of dividend history, RTX represents a reliable option for income-seeking investors. Despite a relatively modest dividend yield, the company showcases steady growth and sound financial metrics, signaling a stable investment opportunity. However, investors should remain aware of its elevated payout ratios, suggesting the need for cautious future growth management.
📊 Overview
RTX Corporation, renowned within the aerospace and defense sector, presents investors with the potential for stable income generation through dividends. Here’s a detailed look at its current standing:
| Metric | Value |
|---|---|
| Sector | Aerospace & Defense |
| Dividend yield | 1.70% |
| Current dividend per share | 2.41 USD |
| Dividend history | 56 years |
| Last cut or suspension | None |
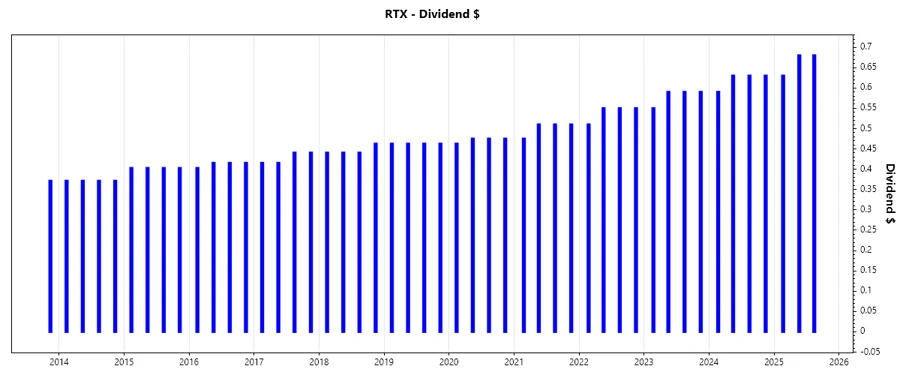
📈 Dividend History
The extensive 56-year dividend history of RTX underscores its commitment to returning value to shareholders. Consistent dividend payments are indicative of the company's robust earning capabilities and stable financial health.
Recent dividend payments:
| Year | Dividend Per Share (USD) |
|---|---|
| 2025 | 1.99 |
| 2024 | 2.48 |
| 2023 | 2.32 |
| 2022 | 2.16 |
| 2021 | 2.005 |
📈 Dividend Growth
The growth pattern over the years is essential for evaluating future prospects. A strong growth rate can indicate better future returns.
| Time | Growth |
|---|---|
| 3 years | 7.34% |
| 5 years | 6.03% |
The average dividend growth is 6.03% over 5 years. This shows moderate but steady dividend growth.
💼 Payout Ratio
Payout ratios are crucial as they determine the sustainability of dividend distributions. A high payout ratio, while offering higher immediate returns, may limit growth potential.
| Key Figure | Ratio |
|---|---|
| EPS-based | 49.10% |
| Free cash flow-based | 61.73% |
The EPS payout ratio of 49.10% illustrates a balanced approach toward maintaining reinvestment potential while the FCF ratio at 61.73% suggests steady cash distribution aligned with available free cash flow.
💰 Cashflow & Capital Efficiency
Effective cash management and capital efficiency highlight the company's capability of satisfying both operational and shareholder obligations. They are indicators of fundamental strength in the financial landscape.
| Year | 2024 | 2023 | 2022 |
|---|---|---|---|
| Free Cash Flow Yield | 2.94% | 3.93% | 2.95% |
| Earnings Yield | 3.10% | 2.66% | 3.49% |
| CAPEX to Operating Cash Flow | 34.23% | 40.16% | 38.71% |
| Stock-based Compensation to Revenue | 0.54% | 0.62% | 0.63% |
| Free Cash Flow / Operating Cash Flow Ratio | 63.33% | 59.84% | 61.29% |
With stable cash flow yields and efficient CAPEX management, RTX demonstrates robust capital utilization practices. Stock-based compensations remain competitively low, supporting the overall financial health.
📚 Balance Sheet & Leverage Analysis
A solid balance sheet fortifies a company's financial stability, driving long-term sustainability. Understanding debt levels and leverage provides insight into potential risks and resilience in adverse conditions.
| Year | 2024 | 2023 | 2022 |
|---|---|---|---|
| Debt-to-Equity | 71.30% | 75.65% | 46.12% |
| Debt-to-Assets | 26.34% | 27.95% | 21.09% |
| Debt-to-Capital | 41.62% | 43.07% | 31.56% |
| Net Debt to EBITDA | 3.07 | 4.12 | 2.44 |
| Current Ratio | 1.07 | 1.04 | 1.09 |
| Quick Ratio | 0.75 | 0.78 | 0.81 |
| Financial Leverage | 2.71 | 2.71 | 2.19 |
RTX's leverage is manageable, but investors should keep an eye on rising debt metrics. Efficient liquidity ratios bolster the overall balance sheet's robustness.
📈 Fundamental Strength & Profitability
Analyzing the core financial returns and profitability margins provides insight into the company's operational efficiency and competitive edge.
| Year | 2024 | 2023 | 2022 |
|---|---|---|---|
| Return on Equity | 7.94% | 5.34% | 7.15% |
| Return on Assets | 2.93% | 1.97% | 3.27% |
| Net Margin | 5.91% | 4.64% | 7.75% |
| EBIT Margin | 10.11% | 7.96% | 11.06% |
| EBITDA Margin | 15.07% | 13.60% | 16.66% |
| Gross Margin | 19.09% | 17.54% | 20.38% |
| R&D to Revenue | 3.63% | 4.07% | 4.04% |
RTX's profitability indicators demonstrate solid operational execution. Continual R&D investment fosters innovation, sustaining competitive advantages.
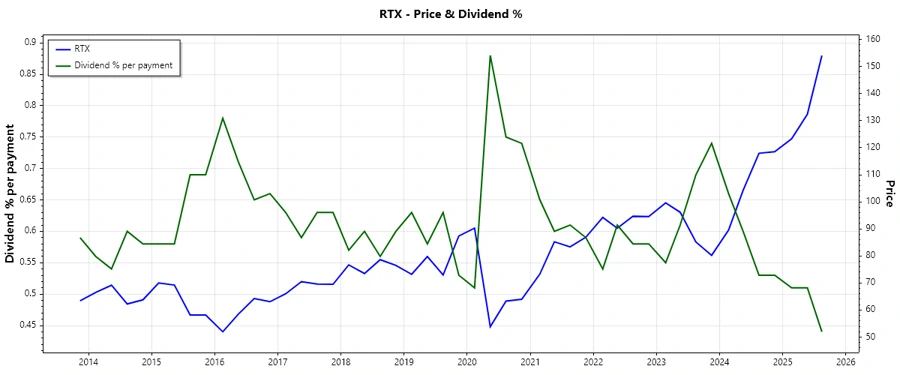
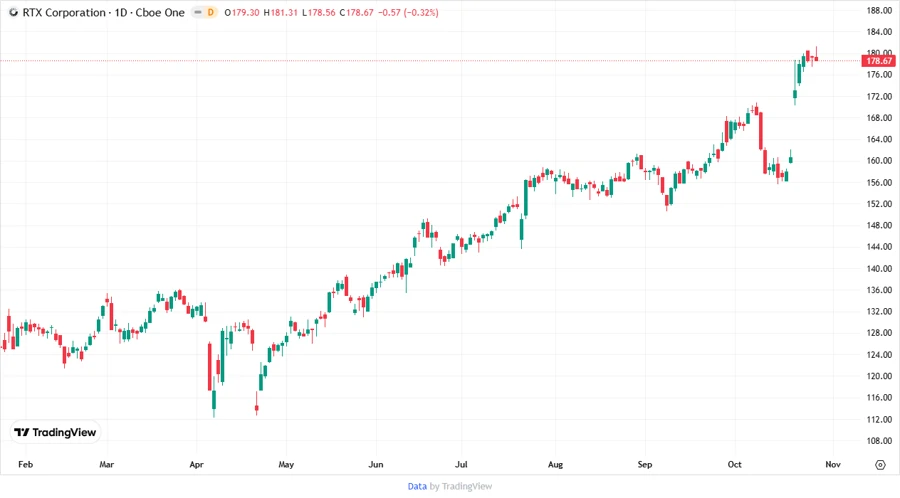
📉 Price Development
✅ Dividend Scoring System
| Category | Score | Indicator |
|---|---|---|
| Dividend yield | 3 | |
| Dividend Stability | 5 | |
| Dividend growth | 4 | |
| Payout ratio | 3 | |
| Financial stability | 4 | |
| Dividend continuity | 5 | |
| Cashflow Coverage | 4 | |
| Balance Sheet Quality | 4 |
Overall Score: 32/40
🔍 Rating
RTX Corporation exhibits high dividend stability and growth, backed by robust financial metrics. While its yield is on the moderate side, the company's strategic reinvestment supports sustainable long-term payouts. Cautious monitoring of payout ratios and financial leverage is warranted. RTX is recommended as a strong component of a diversified income strategy, holding potential for consistent dividend returns with the added benefit of solid capital appreciation prospects.
Smart Data Insight
Master the Perfect Entry & Exit for this Stock
Don't leave your profits to chance. Historically, this stock follows specific seasonal patterns that institutional traders use to maximize returns.
- ✅ Identify the "Golden Buying Window"
- ✅ Avoid high-risk correction cycles
- ✅ Backtested data from the last 20+ years