August 03, 2025 a 07:32 am

RTX: Dividend Analysis - RTX Corporation
RTX Corporation continues to be a solid dividend-paying company, offering a moderate dividend yield coupled with a long-standing history of uninterrupted payouts. The company’s dividend growth rates align with moderate but steady improvements, signifying a dependable source of income for dividend investors. Operating in the {{sector}}, RTX has displayed resilience and stability in its financials.
Overview 📊
Detailed Assessment of RTX's current financial data indicates a stable dividend yield and a strong dividend history. Consistent payout history reflects company stability.
| Metric | Value |
|---|---|
| Sector | Aerospace & Defense |
| Dividend Yield | 1.67% |
| Current Dividend per Share | 2.41 USD |
| Dividend History | 56 years |
| Last Cut or Suspension | None |
Dividend History 🗣️
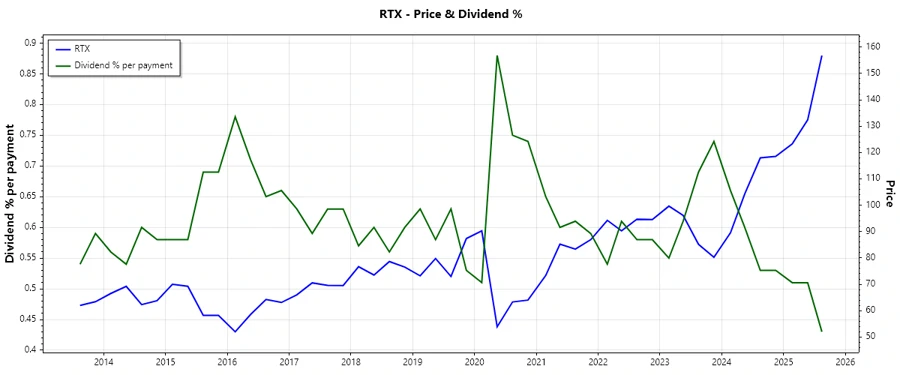
RTX’s dividend history showcases its commitment to returning value to shareholders through consistent payments. This history is crucial as it indicates the company's financial health and investor confidence.
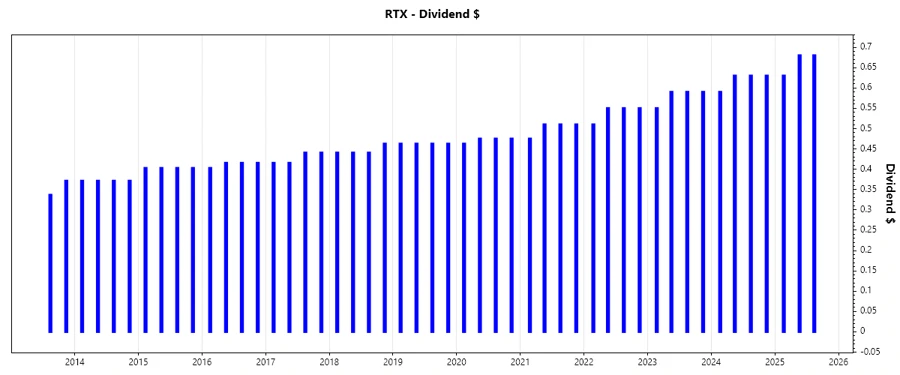
| Year | Dividend per Share (USD) |
|---|---|
| 2025 | 1.99 |
| 2024 | 2.48 |
| 2023 | 2.32 |
| 2022 | 2.16 |
| 2021 | 2.005 |
Dividend Growth 📈
Understanding the growth of dividends helps in assessing future potential and reliability of continued payments. RTX has demonstrated moderate but continued growth in dividends over the years.
| Time | Growth |
|---|---|
| 3 years | 7.34% |
| 5 years | 6.03% |
The average dividend growth is 6.03% over 5 years. This shows moderate but steady dividend growth.
Payout Ratio ⚠️
The payout ratio reveals how much of the earnings and cash flow are used to cover dividend payments, highly indicative of sustainability.
| Key Figure | Ratio |
|---|---|
| EPS-based | 51.29% |
| Free cash flow-based | 105.85% |
While the EPS-based payout ratio is conservatively managed at 51.29%, the FCF-based payout ratio at 105.85% indicates a potential strain on cash flows, signaling caution for future cash dividend commitments.
Cashflow & Capital Efficiency
A robust cash flow and efficient capital allocation are critical for maintaining dividend payouts and supporting company growth. RTX’s cash flow metrics display moderate strength.
| Metric | 2024 | 2023 | 2022 |
|---|---|---|---|
| Free Cash Flow Yield | 2.94% | 3.93% | 2.95% |
| Earnings Yield | 3.10% | 2.67% | 3.49% |
| CAPEX to Operating Cash Flow | 37% | 40% | 39% |
| Stock-based Compensation to Revenue | 0.54% | 0.62% | 0.63% |
| Free Cash Flow / Operating Cash Flow Ratio | 63.33% | 59.84% | 61.29% |
Despite stable operating efficiencies, the high CAPEX requirements relative to operating cash flows reflect necessary reinvestments which could tighten voluntary dividend increases.
Balance Sheet & Leverage Analysis
An examination of the balance sheet positions provides insight into financial strength and resilience against economic headwinds.
| Metric | 2024 | 2023 | 2022 |
|---|---|---|---|
| Debt-to-Equity | 0.719 | 0.757 | 0.461 |
| Debt-to-Assets | 0.266 | 0.279 | 0.211 |
| Debt-to-Capital | 0.418 | 0.431 | 0.316 |
| Net Debt to EBITDA | 3.01 | 4.02 | 2.44 |
| Current Ratio | 0.993 | 1.035 | 1.085 |
| Quick Ratio | 0.745 | 0.784 | 0.814 |
| Financial Leverage | 2.707 | 2.707 | 2.187 |
RTX's leverage ratios are moderate, with a slightly higher net debt to EBITDA indicating adequate capacity to meet long-term durable obligations, although improvements in liquidity ratios would be favorable.
Fundamental Strength & Profitability
Profitability metrics help determine the company’s efficiency at generating earnings relative to its resources.
| Metric | 2024 | 2023 | 2022 |
|---|---|---|---|
| Return on Equity | 7.94% | 5.34% | 7.16% |
| Return on Assets | 2.93% | 1.97% | 3.27% |
| Net Margin | 5.91% | 4.64% | 7.75% |
| EBIT Margin | 10.11% | 7.96% | 11.06% |
| EBITDA Margin | 15.52% | 13.95% | 16.66% |
| Gross Margin | 19.09% | 17.54% | 20.38% |
| R&D to Revenue | 3.63% | 4.07% | 4.04% |
RTX demonstrates solid fundamental strength; however, a modest return on equity suggests constrained returns, necessitating improved operational efficiencies to enhance profitability.
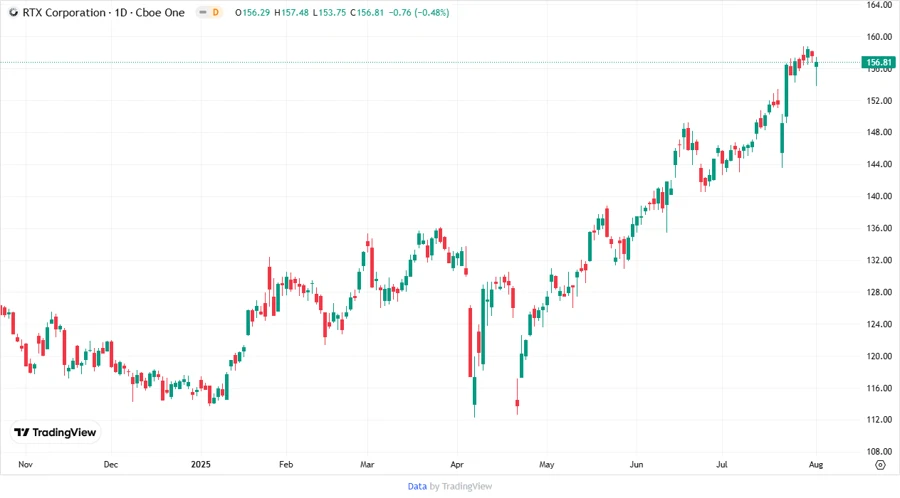
Price Development
Dividend Scoring System ✅
| Category | Score | Score Bar |
|---|---|---|
| Dividend Yield | 3 | |
| Dividend Stability | 5 | |
| Dividend Growth | 3 | |
| Payout Ratio | 2 | |
| Financial Stability | 4 | |
| Dividend Continuity | 5 | |
| Cashflow Coverage | 3 | |
| Balance Sheet Quality | 4 |
Total Score: 29/40
Rating ⚖️
RTX Corporation presents as a stable dividend-payer with strong historical commitment. The moderate growth and stable yield may appeal to risk-conscious investors seeking reliability. However, cautious monitoring of payout ratios and cash flow is advised to ensure sustained future dividends.
Smart Data Insight
Master the Perfect Entry & Exit for this Stock
Don't leave your profits to chance. Historically, this stock follows specific seasonal patterns that institutional traders use to maximize returns.
- ✅ Identify the "Golden Buying Window"
- ✅ Avoid high-risk correction cycles
- ✅ Backtested data from the last 20+ years